

Abstract
Background: Structural differences associated with depression have not been confirmed in brain regions apart from the hippocampus. Comorbid anxiety has been inconsistently assessed, and may explain discrepancies in previous findings. We investigated the link between depression, comorbid anxiety and brain structure.
Methods: We followed Preferred Reporting Items for Systematic Review and Meta-Analyses (PRISMA) guidelines (PROSPERO CRD42018089286). We searched the Cochrane Library, MEDLINE, PsycInfo, PubMed and Scopus, from database inception to Sept. 13, 2018, for MRI case–control studies that reported brain volumes in healthy adults and adults with clinical depression. We summarized mean volumetric differences using meta-analyses, and we assessed demographics, depression factors and segmentation procedure as moderators using meta-regressions.
Results: We included 112 studies in the meta-analyses, assessing 4911 healthy participants and 5934 participants with depression (mean age 49.8 yr, 68.2% female). Volume effects were greater in late-onset depression and in multiple episodes of depression. Adults with depression and no comorbidity showed significantly lower volumes in the putamen, pallidum and thalamus, as well as significantly lower grey matter volume and intracranial volume; the largest effects were in the hippocampus (6.8%, p < 0.001). Adults with depression and comorbid anxiety showed significantly higher volumes in the amygdala (3.6%, p < 0.001). Comorbid anxiety lowered depression effects by 3% on average. Sex moderated reductions in intracranial volume.
Limitations: High heterogeneity in hippocampus effects could not be accounted for by any moderator. Data on symptom severity and medication were sparse, but other factors likely made significant contributions.
Conclusion: Depression-related differences in brain structure were modulated by comorbid anxiety, chronicity of symptoms and onset of illness. Early diagnosis of anxiety symptomatology will prove crucial to ensuring effective, tailored treatments for improving long-term mental health and mitigating cognitive problems, given the effects in the hippocampus.
Introduction
Globally, depression is the most prevalent and disabling psychiatric disorder.1,2 It affects approximately 4.4% of the population, is the leading reason for disease burden2 and is the fourth leading cause of disability.1,3 The burden and prevalence of depression have increased steadily as a result of population growth and aging1,2; given that this trend is expected to continue, it is critical that we better understand the neurobiological determinants and progression of depression to improve prevention and management. Although a vast literature is available investigating the structural brain changes associated with depression, no consensus has been established for direction or magnitude. Indeed, even in the hippocampus — which has consistently been found to be substantially smaller in people with depression4–12 — the magnitude of the effect is variable and appears to be dependent on age, number of depressive episodes and illness duration,7,12 remission status5,10 and laterality.6–8 Furthermore, increasing evidence that some pharmacological treatments may be protective against volume loss11,13–16 add further variability to these findings.
Depression is not a uniform disorder, and comorbidity with other psychiatric disorders (most notably anxiety2,17) intrinsically imposes variability on the research. Anxiety is the second most prevalent psychiatric disorder,1,2 and depression comorbid with anxiety has been associated with poorer health outcomes, including more severe symptoms and higher levels of suicidal ideation.18 Given comorbidity rates as high as 50%,17,18 it is vital to exclude — or at least account for — anxiety disorders when investigating structural brain changes associated with depression. Previous reviews have focused largely on the effects of age and sex — and on variables such as symptom severity, number of episodes and medication4–8,10,12,19–21 — to explain some of the variability in brain volume. Only 2 of these reviews5,12 addressed anxiety comorbidity, and although they reported no moderating effects, a voxel-based morphometry review22 contradicted these results.
The present study aimed to provide a comprehensive summary of the literature investigating structural brain changes with depression, considering global and regional volumetric measures using MRI and a specific type of depressive disorder (major depressive disorder) and its different subclassifications to provide a more targeted approach. Crucially and unlike previous reviews, the present study also comprehensively investigated the effect of comorbidity in an effort to distinguish the contributions of depression from those of anxiety. It provides precise volumetric difference estimates not currently available in the literature.
Methods
This systematic review with meta-analysis followed the Preferred Reporting Items for Systematic Reviews and Meta-Analyses (PRISMA) guidelines23 and was prospectively registered in the PROSPERO database (CRD42018089286).
Search strategy
We searched the Cochrane Library, MEDLINE, PsycInfo, PubMed and Scopus from database inception to Sept. 13, 2018, to identify studies reporting on depression, anxiety and brain measures obtained by MRI in humans. We used the following search string: (brain or grey matter or white matter or cortex or lobe or frontal or parietal or temporal or occipital or cingulate or CC or hippocamp* or amygdala* or hypothalamus or basal ganglia) and (atrophy or change or difference or volume or volumetr*) and (MRI or magnetic resonance imag* or neuroimaging) and (depress* or major depressive disorder or MDD or suicide* or low mood or sad or sadness or anx* or neurotic* or stress or distress or generalized anxiety disorder or GAD or social anxiety). Whenever possible, we used database filters to exclude nonhuman studies and studies not published in English.
Screening
Duplicate records were removed, and a single author (D.E.O.) excluded irrelevant entries by title screening. The abstracts of the remaining records were then double-screened by 2 other authors, and any discrepancies were resolved by consensus. Finally, following the same method, we retrieved full-text and supplemental material of the selected studies for screening against the inclusion and exclusion criteria. We also examined the bibliographies of retrieved studies and previous reviews to identify any additional studies for inclusion.
Inclusion and exclusion criteria
Studies were included based on the following criteria: was an empirical study; examined global, lobar or regional brain volumes in adult human samples; measurement of brain volume was derived from structural MRI data using manual or automated segmentation; and included at least 1 group of cognitively healthy participants free of psychiatric illness contrasted with participants who were clinically diagnosed with depression (based on the Diagnostic and Statistical Manual of Mental Disorders or the International Classification of Diseases), with or without comorbid anxiety disorders.
Studies were excluded based on the following criteria: were randomized controlled trials; reported only postmortem MRI data; did not report brain volumes; focused exclusively on samples with behavioural problems, substance abuse, systemic illness or major structural abnormalities (i.e., stroke, brain injury); involved whole samples with mental illness other than depression or depression comorbid with anxiety disorders; did not provide sex or age of the sample, or included participants younger than 18 years; had samples of fewer than 40 participants in total; or were published in a language other than English.
Data extraction
To avoid transcription errors, data were double-extracted by 2 authors, and any discrepancies were resolved by consensus. We extracted the mean and standard deviation (SD) of raw volumes for healthy controls and participants with depression. We converted other measures of variance to SD according to published methods,24 and the unit of measurement was set to millilitres. Further details on extracted variables can be found in Appendix 1, available at jpn.ca/190156-a1. Whenever essential data were not reported, they were requested directly from authors. If data could not be obtained, studies were excluded from statistical analyses. Only cross-sectional data were used in this review.
During data extraction, we identified studies reporting on the same or overlapping samples, on homogeneous populations or on particular depression subgroups. Subgroup classifications included current or remitted depression; a subtype of depression (melancholic, psychotic or atypical); first or multiple episodes of depression; age of onset of depression (pediatric, adult, early or late); family history of depression; intake of antidepressants; treatment resistance; comorbidity with anxiety disorders; suicide attempt or ideation; and physical or sexual abuse. Heterogeneous samples and samples that could not be included in the above categories because of a lack of information were merged into a single separate group to account for some variability (mixed group; Appendix 1).
Primary outcome measure
The primary outcome measure was the mean difference between brain volumes in healthy controls and participants with depression. Thus, positive outcome measures corresponded to higher volumes in healthy controls, and negative outcome measures corresponded to higher volumes in participants with depression. We investigated total brain volume, grey matter volume, white matter volume and intracranial volume using mean difference in total volume. We investigated subcortical structures using mean differences in total, right and left volumes. When total volumes were not reported, we derived mean and SD volumes from the right and left volumes (Appendix 1).
Statistical analysis
We used R version 3.3.125 for Windows to conduct statistical analyses. We conducted meta-analyses and meta-regressions using the metafor package version 1.9–9.26
Meta-analyses
We conducted all meta-analyses using a random-effects model with a restricted maximum likelihood estimator, where the summary outcome was the mean of the distribution of volume differences adjusted for sample size.27 We examined heterogeneity using the Cochran Q statistic, which provides the ratio of variation within studies (significance p ≤ 0.05),27 and the I2 statistic, which provides a measure of inconsistency across observed volume differences (25%, 50% and 75% corresponding to low, moderate and high, respectively27,28). Finally, we examined the spread of observed volume differences using the τ2 statistic, which shows the variance of the summary outcome.27
We conducted meta-analyses focused on different brain areas or clinical subgroups provided that a minimum of 3 studies were available. Furthermore, we examined the effect of comorbidity between depression and anxiety disorders where possible with studies that excluded or included clinically diagnosed anxiety, either by axis I or explicit comorbidity exclusion (Appendix 1). Management of duplicate samples was specific to brain region and type of analysis. Whenever we identified duplicates, we included the study with the largest sample size and excluded all others from the specific analysis. If the sample size was identical, we included the most recent study and all others excluded from the specific analysis. A p ≤ 0.05 was considered significant.
Meta-regressions
We investigated the moderating effects of age and sex on mean volumetric differences in total brain volume, hippocampal volume and intracranial volume given the greater number of included studies.27 In line with this principle, we further investigated segmentation procedure, depressive symptoms and medication status for hippocampal volume. We centred age at 30 years to provide a meaningful estimate of volumetric differences. We investigated sex first as percentage of female participants, and then as the difference in the percentage of female participants among healthy controls and participants with depression because of high variability in some studies. We investigated segmentation by contrasting manual and automated segmentation. We investigated depressive symptoms with the 17-item Hamilton Depression Rating Scale, given the greater number of studies reporting this measure. Finally, we investigated medication status as the percentage of participants taking antidepressants ( Appendix 1). We further investigated the effect of age in meta-analyses stratified by participants younger than 55 years and participants 55 years and older. We found no significant differences between these groups (data not shown).
Sensitivity analyses
Because the summary outcome is dependent on the type of samples being contrasted, we conducted sensitivity analyses to investigate the influence of studies reporting measures for participants with depression in mixed groups and homogeneous groups. We found no significant differences (Appendix 1, Tables S6 and S7). Finally, we used the leave-one-out method to determine whether individual studies contributed disproportionately to any inhomogeneity of effects.
Quality assessment
Two authors independently assessed the quality of the studies based on a modified version of the Newcastle–Ottawa Scale (Appendix 1);29 discrepancies were resolved by consensus.
Bias assessment
We assessed publication bias graphically using funnel plots. We used the Egger regression test26,30,31 with standard error as a predictor to provide objective interpretation. We used the trim-and-fill method32,33 to estimate the effect of any extreme studies missing from the meta-analyses.
Results
Literature search
Online searches identified 9229 unique references, and manual searches identified a further 19 studies, leaving 9248 studies for screening after duplicates were removed (Fig. 1). Following exclusion of irrelevant references and assessment against inclusion and exclusion criteria, 327 studies were included in the review. Of these, 31 population studies and 75 voxel-based morphometry studies were further excluded. After accounting for duplicate samples and structures not included because of insufficient numbers of studies (Appendix 1), 112 studies were included in meta-analyses with a total of 10 845 participants (4911 healthy controls and 5934 participants with depression; mean age 49.8 yr, 68.2% female). A detailed description of these studies is provided in Appendix 1, Table S2. The average Newcastle–Ottawa Scale rating was 6.9, with a minimum score of 4.5 in 3 studies (Appendix 1, Table S3). The Newcastle–Ottawa Scale scores had no moderating effects (Appendix 1).
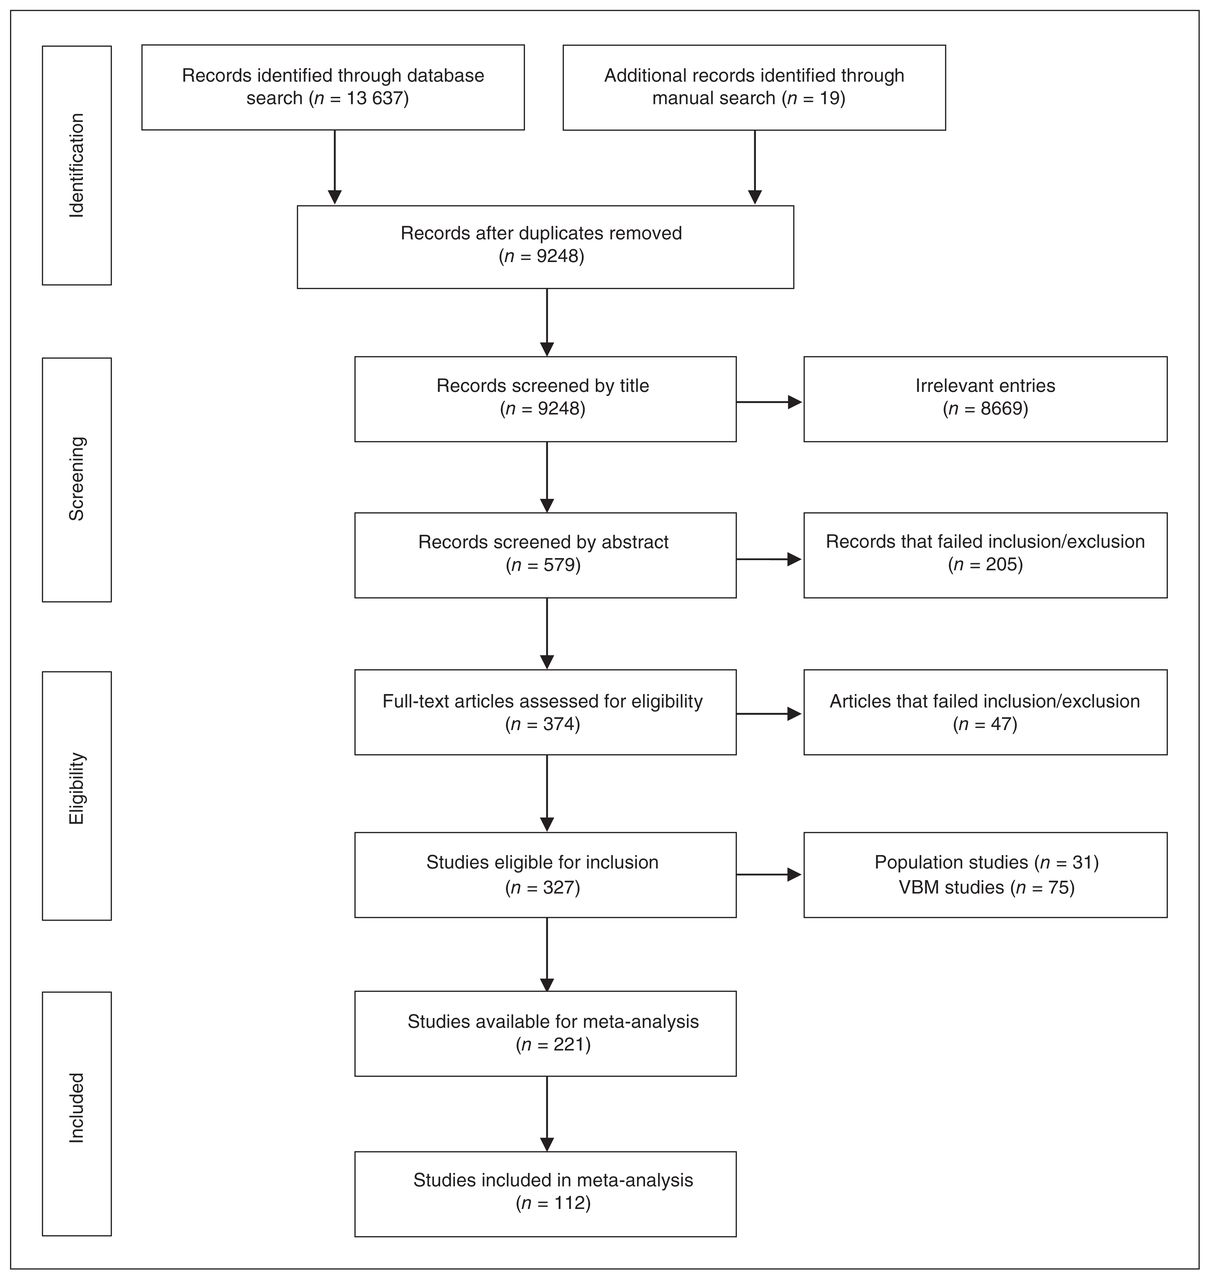
Preferred Reporting Items for Systematic Reviews and Meta-Analyses (PRISMA) flowchart of included studies. VBM = voxel-based morphometry.
Main effect of depression
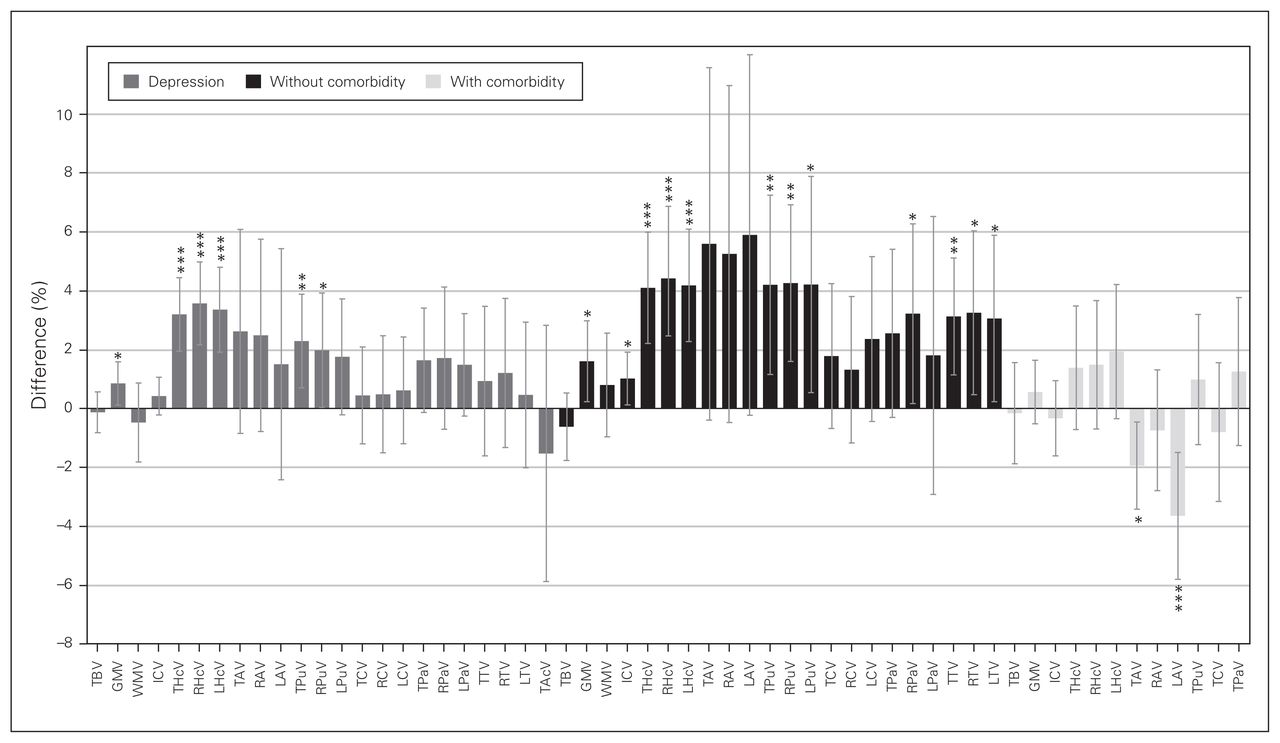
We investigated 11 regions, given minimum requirements: 4 global and 7 subcortical structures. A summary of volumetric differences between healthy controls and participants with depression in each region is provided in Figure 2 (left), showing greater effects in subcortical structures. We found no significant volume differences in the total brain (31 studies), amygdala (total volume: 16 studies; right/left: 14 studies), caudate (total volume: 13 studies; right/left: 9 studies), pallidum (total volume: 9 studies, right/left: 7 studies), accumbens (4 studies) or white matter (10 studies; Table 1 and Appendix 1, Table S4 for detailed demographics).

Volumetric differences in depression. Percent difference between volumes of healthy controls and participants with depression per brain region in depression (left, grey), and the effects without comorbid anxiety (middle, black) and with comorbid anxiety (right, light grey). Positive values represent greater volumes in healthy controls, and negative values represent greater volume in participants with depression. Error bars represent 95% confidence intervals. ***p < 0.001, **p < 0.01, *p < 0.05. GMV = grey matter volume; ICV = intracranial volume; LAV = left amygdala volume; LCV = left caudate volume; LHcV = left hippocampus volume; LPaV = left pallidum volume; LPuV = left putamen volume; LTV = left thalamus volume; RAV = right amygdala volume; RCV = right caudate volume; RHcV = right hippocampus volume; RPaV = right pallidum volume; RPuV = right putamen volume; RTV = right thalamus volume; TAcV = total accumbens volume; TAV = total amygdala volume; TBV = total brain volume; TCV = total caudate volume; THcV = total hippocampus volume; TPaV = total pallidum volume; TPuV = total putamen volume; TTV = total thalamus volume; WMV = white matter volume.
Meta-analyses per brain region
Grey matter volume
Fifteen studies reported grey matter volume differences (n = 1788, age = 40.8 yr, 57.3% female).17,34–47 Significant differences represented 0.9% (z = 2.274, p = 0.023) lower grey matter volume in participants with depression (Table 1, Fig. 3A and Appendix 1, Fig. S3).

Volumetric effect of depression in grey matter. Forest plots of (A) the main effect of depression and (B) the effect of depression excluding comorbid anxiety in grey matter. Positive values represent greater volume in healthy controls, and negative values represent greater volumes in participants with depression. Unit of measurement is millilitres. CI = confidence interval; DEP = participants with depression; GMV = grey matter volume; HC = healthy controls; MD = mean difference; RE = random effects.
Hippocampus
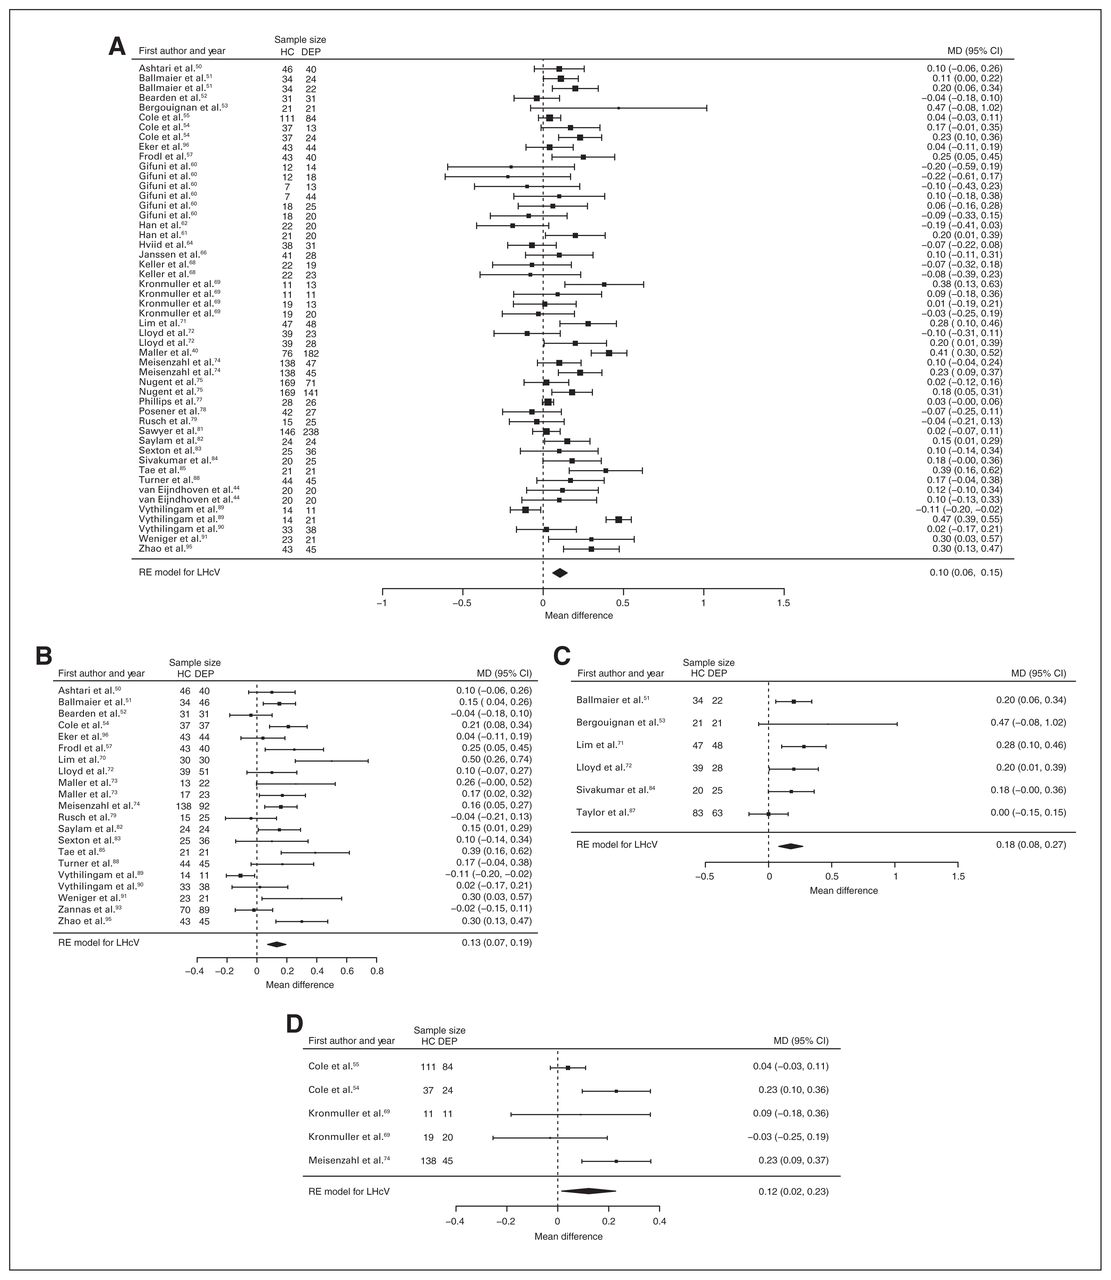
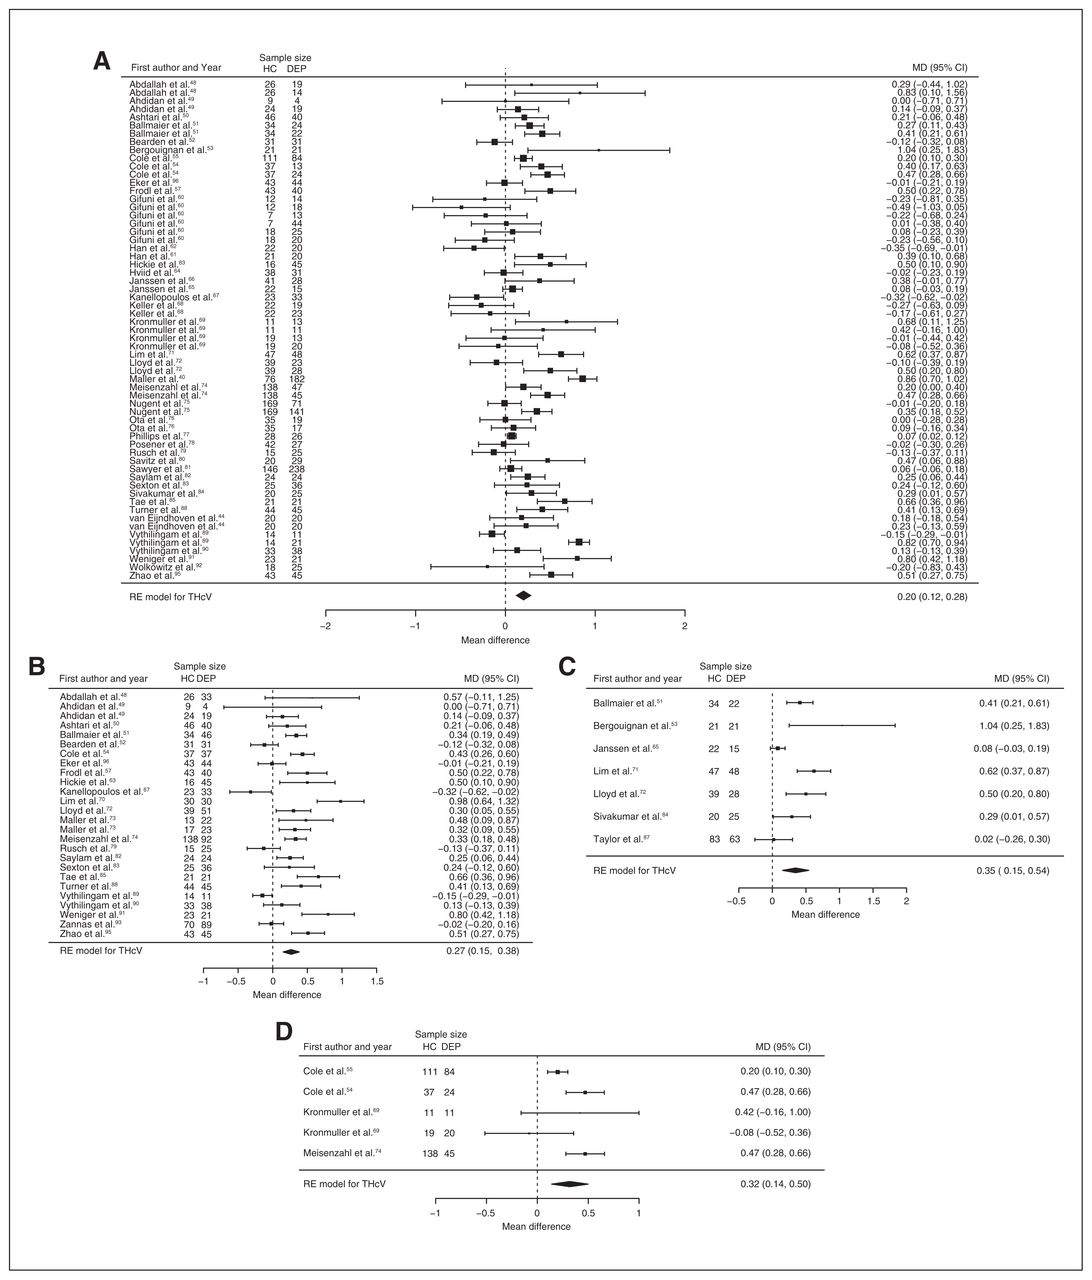
Fifty-one studies reported total hippocampal volume differences (n = 4723, age 48.6 yr, 63.2% female).21,40,44,48–95 Significant differences represented 3.2% (z = 5.026, p < 0.001) lower total hippocampal volume in participants with depression. We also found significant differences in 3 subgroups indicating that, compared with healthy controls, participants with depression in mixed groups had 4.3% (z = 4.487, p < 0.001) lower total hippocampal volume, participants with late-onset depression had 5.9% (z = 3.464, p < 0.001) lower total hippocampal volume and participants with depression with multiple episodes had 5.9% (z = 3.503, p < 0.001) lower total hippocampal volume. All significant results showed significant heterogeneity (Table 1, Fig. 4 and Appendix 1, Fig. S5).

Volumetric effect of depression in total hippocampus. Forest plots of (A) the main effect of depression in total hippocampus, and of the effect of depression in total hippocampus for the following subgroups: (B) mixed group, (C) late-onset depression and (D) multiple episodes of depression. Positive values represent greater volumes in healthy controls, and negative values represent greater volumes in participants with depression. Unit of measurement is millilitrers. CI = confidence interval; DEP = participants with depression; HC = healthy controls; MD = mean difference; RE = random-effects; THcV = total hippocampus volume.
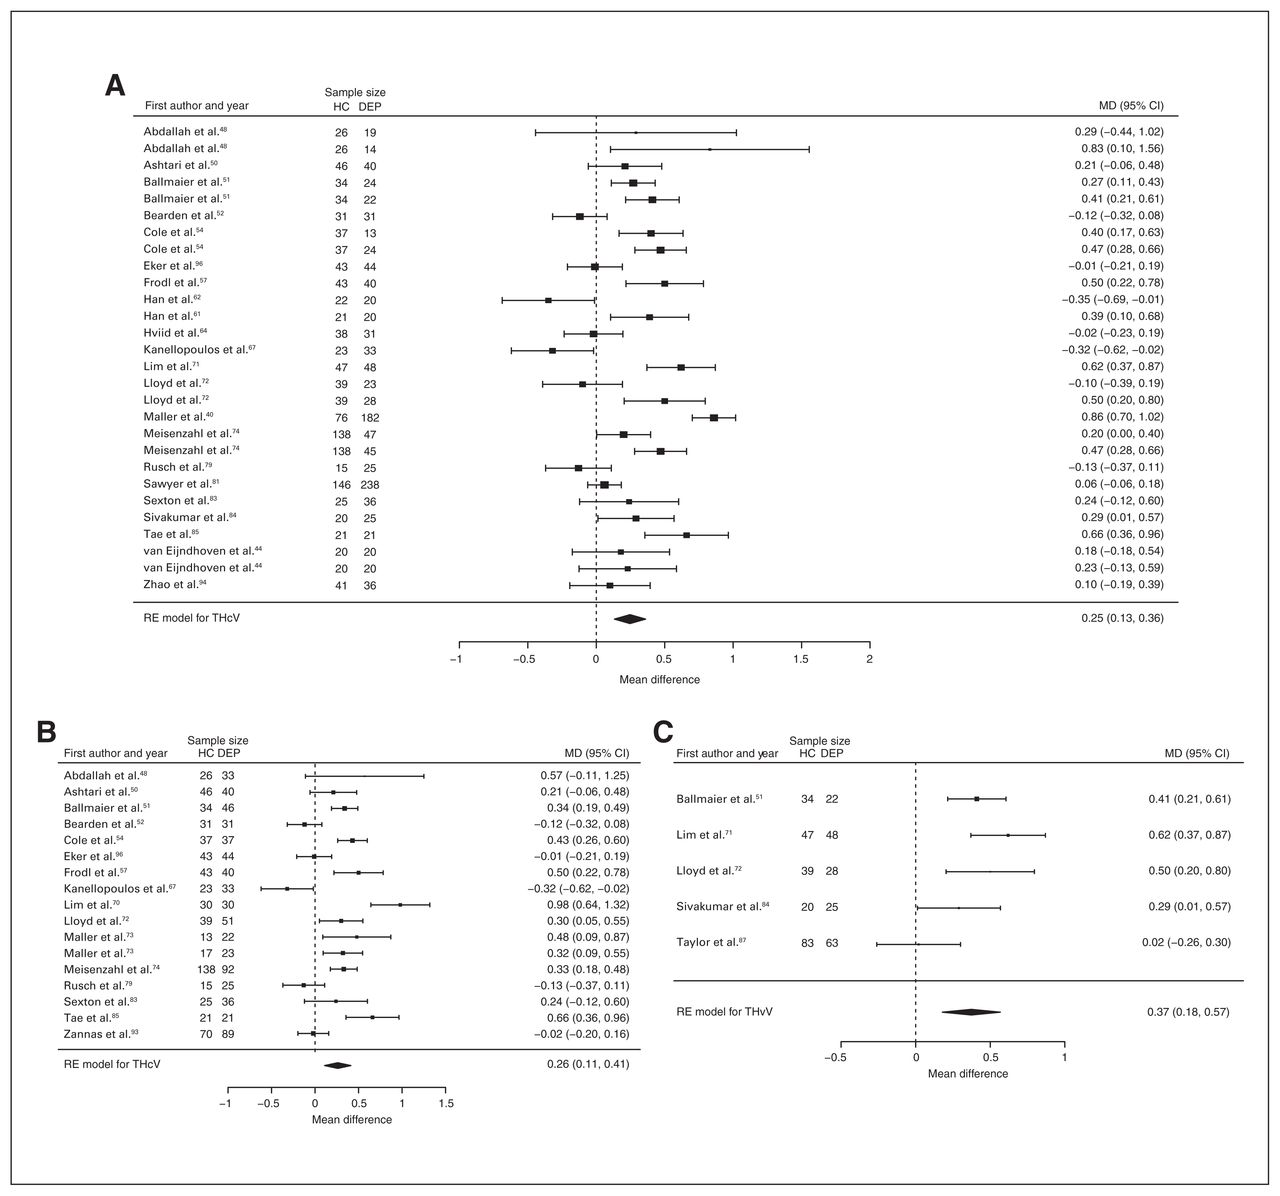
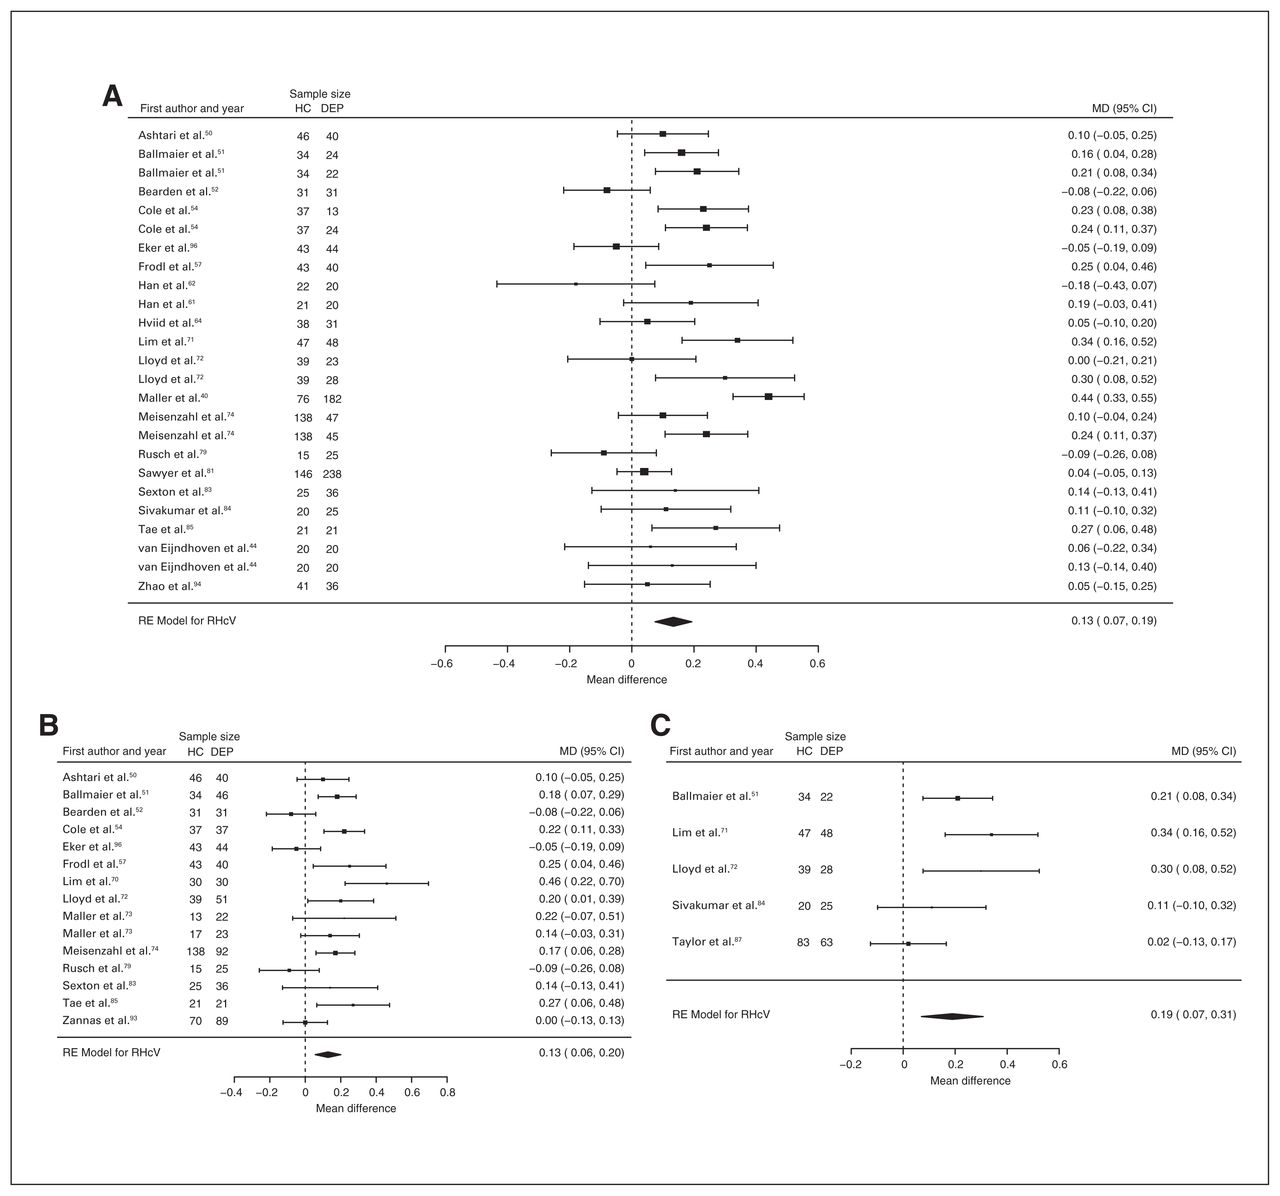
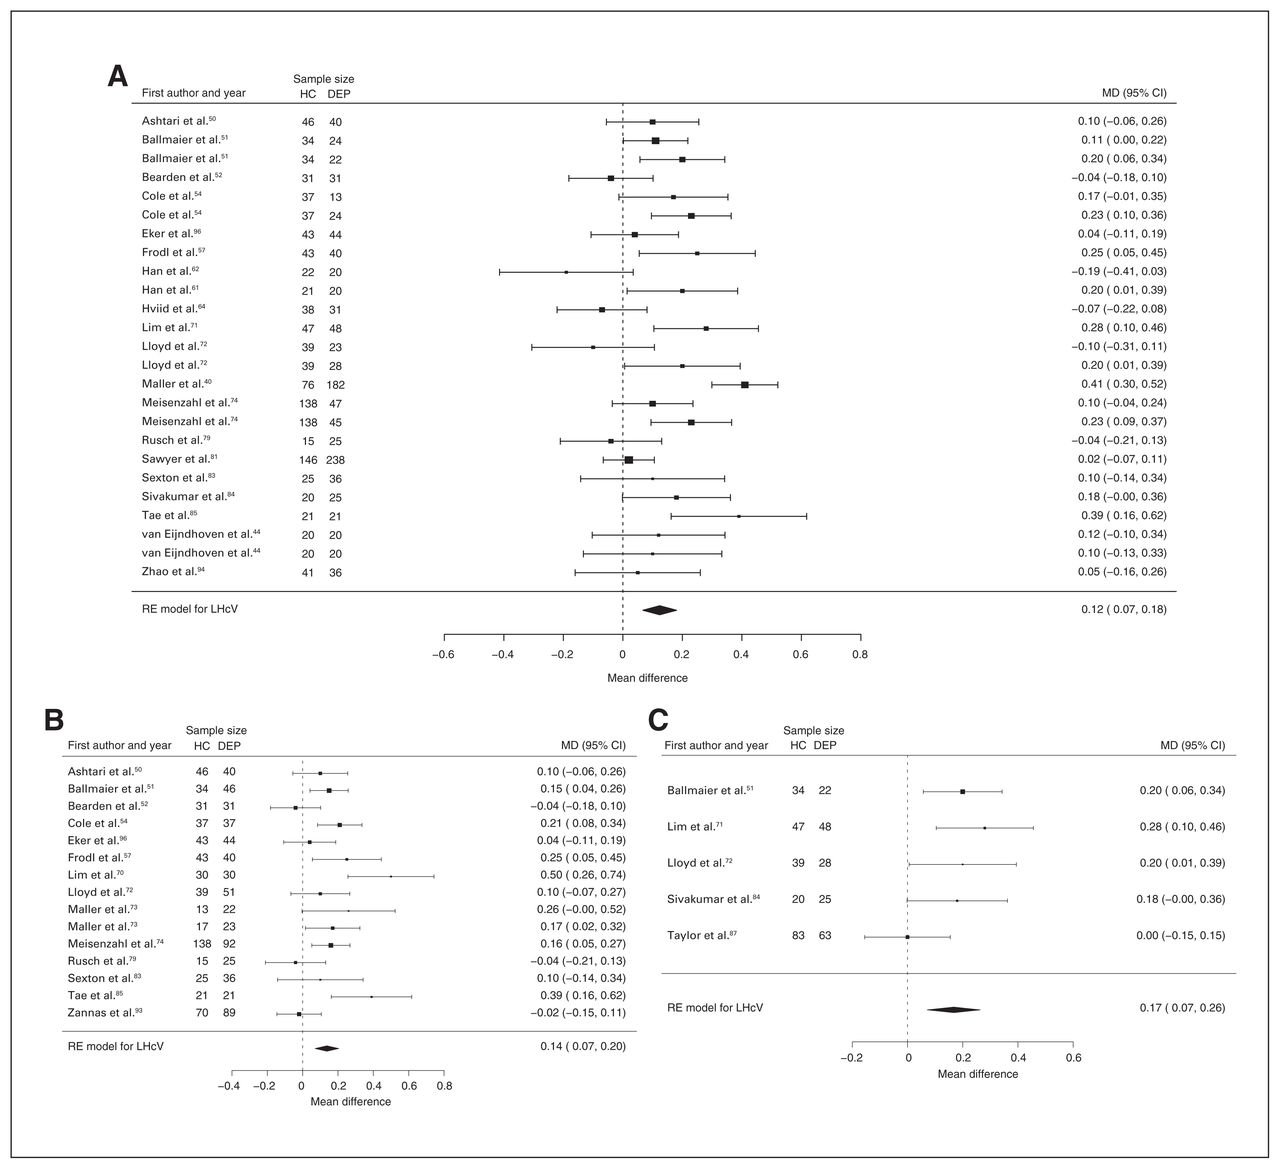
Forty-three studies reported right and left hippocampal volume differences (n = 4291, age 48.8 yr, 63.2% female).40,44,50–58,60–62,64,66,68–75,77–79,81–91,93–97 Significant differences represented 3.6% (z = 4.963, p < 0.001) lower right and 3.4% (z = 4.561, p < 0.001) lower left hippocampal volume in participants with depression. We also found significant differences in 3 subgroups indicating that, compared with healthy controls, participants with depression in mixed groups had 4.4% (z = 4.347, p < 0.001) lower right and 4.4% (z = 4.227, p < 0.001) lower left hippocampal volume, participants with late-onset depression had 6.8% (z = 3.360, p < 0.001) lower right and 6.2% (z = 3.622, p < 0.001) lower left hippocampal volume and participants with depression with multiple episodes had 6.5% (z = 6.111, p < 0.001) lower right and 4.6% (z = 2.244, p = 0.025) lower left hippocampal volume. We found significant differences in participants with early-onset depression only in right hippocampal volume, representing 4.3% (z = 2.186, p = 0.029) lower volume. With few exceptions, all significant results showed significant heterogeneity (Table 1, Fig. 5, Fig. 6 and Appendix 1, Fig. S7 and S9).

Volumetric effect of depression in right hippocampus. Forest plots of (A) the main effect of depression in right hippocampus, and of the effect of depression in right hippocampus for the following subgroups: (B) mixed group, (C) early-onset depression, (D) late-onset depression and (E) multiple episodes of depression. Positive values represent greater volumes in healthy controls, and negative values represent greater volumes in participants with depression. Unit of measurement is millilitres. CI = confidence interval; DEP = participants with depression; HC = healthy controls; MD = mean difference; RHcV = right hippocampus volume; RE = random effects.
Volumetric effect of depression in left hippocampus. Forest plots of (A) the main effect of depression in left hippocampus, and of the effect of depression in left hippocampus for the following subgroups: (B) mixed group, (C) late-onset depression and (D) multiple episodes of depression. Positive values represent greater volumes in healthy controls, and negative values represent greater volumes in participants with depression. Unit of measurement is millilitres. CI = confidence interval; DEP = participants with depression; HC = healthy controls; LHcV = left hippocampus volume; MD = mean difference; RE: random effects.
Putamen
Thirteen studies reported total putamen volume differences (n = 1693, age 46.1 yr, 62.3% female).60,63,71,75,83,88,94,98–103 Significant differences represented 2.3% (z = 2.823, p = 0.005) lower total putamen volume in participants with depression (Fig. 7A). We also found significant differences in 1 subgroup indicating that compared with healthy controls, participants with depression in mixed groups had 2.4% (z = 2.742, p = 0.006) lower total putamen volume. We found significant heterogeneity in the first analysis (Table 1 and Appendix 1, Fig. S17).
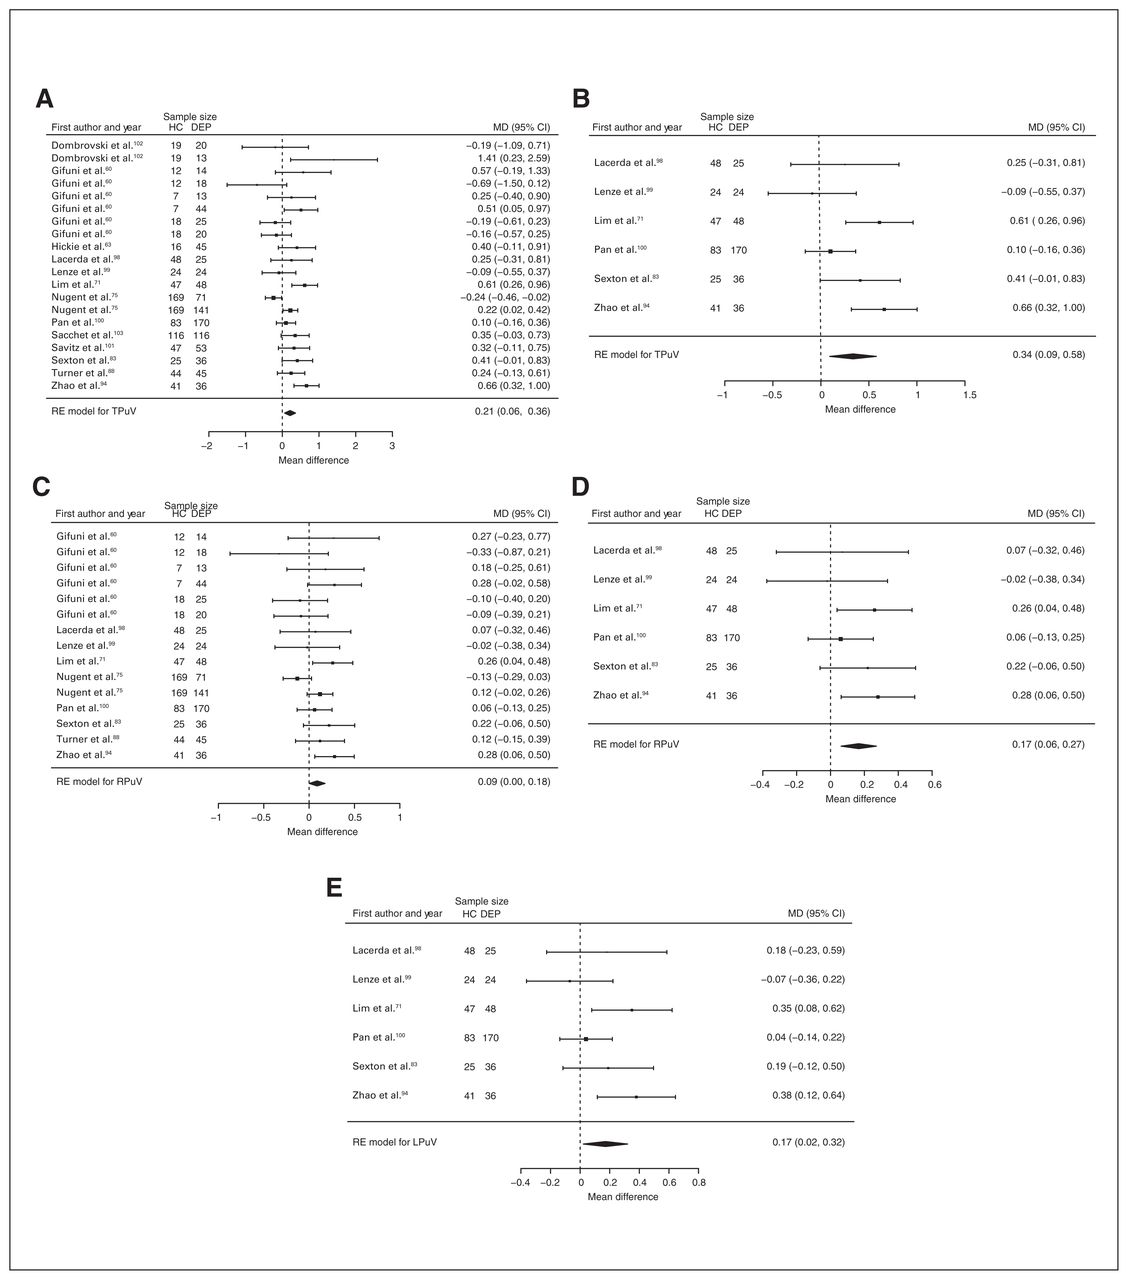
Volumetric effect of depression in putamen. Forest plots of (A) the main effect of depression in total putamen, (B) the effect of depression without comorbid anxiety in total putamen, (C) the main effect of depression in right putamen, (D) the effect of depression without comorbid anxiety in right putamen and (E) the effect of depression without comorbid anxiety in left putamen. Positive values represent greater volume in healthy controls, and negative values represent greater volumes in participants with depression. Unit of measurement is millilitres. CI = confidence interval; DEP = participants with depression; HC = healthy controls; LPuV = left putamen volume; MD = mean difference; RE = random effects; RPuV = right putamen volume; TPuV = total putamen volume.
Nine studies reported right putamen volume differences (n = 1248, age 47.8 yr, 59.3% female).60,71,75,83,88,94,98–100 Significant differences represented 2.0% (z = 1.995, p = 0.046) lower right putamen volume in participants with depression (Table 1, Fig. 7C and Appendix 1, Fig. S19).
Thalamus
Seven studies reported total thalamus volume differences (n = 938, age 43.0 yr, 55.7% female).60,71,75,83,88,94,104 Significant differences represented 5.5% (z = 4.216, p < 0.001) lower total thalamus volume in participants with depression in mixed groups (Table 1 and Appendix 1, Fig. S35).
Intracranial volume
Forty-six studies reported intracranial volume differences (n = 4245, age 51.1 yr, 65.6 female).13,15,34,40,54–56,60,61,63,66,67,70,72,74,76,77,80,82,83,85,86,89–92,105–124 Significant differences represented 0.9% (z = 2.009, p = 0.045) lower intracranial volume in participants with depression in mixed groups (Table 1 and Appendix 1, Fig. S44).
Assessment of comorbid anxiety: analysis excluding anxiety disorders
We investigated 10 regions, given minimum requirements: 4 global and 6 subcortical structures. A summary of volumetric differences between healthy controls and participants with depression in each region is provided in Figure 2 (centre). Effects were 0.7% ± 1.3 (mean ± SD; range −1.3% to 4.5%) greater compared to the main analyses. We found significant differences in 6 of 10 regions investigated (Table 2 and Appendix 1, Table S5 for detailed demographics).
Meta-analyses per brain region in depression excluding comorbidity
Grey matter volume
Eight studies reported grey matter volume differences (n = 892, age 42.0 yr, 55.5% female).17,34,35,38,40,41,43,44 Significant differences represented 1.6% (z = 2.288, p = 0.023) lower grey matter volume in participants with depression and no comorbid anxiety (Table 2 and Fig. 3B; Appendix 1, Fig. S4).
Hippocampus
Thirty studies reported total hippocampal volume differences (n = 2888, age 54.8 yr, 64.1% female).40,44,48,50–52, 54,56–58,61,62,64,67,70–74,79,81,83–87,93,94,96,97 Significant differences represented 4.1% (z = 4.247, p < 0.001) lower total hippocampal volume in participants with depression and no comorbid anxiety. We also found significant differences in 2 subgroups indicating that, compared with healthy controls, participants with depression in mixed groups had 4.4% (z = 3.400, p < 0.001) lower total hippocampal volume and participants with late-onset depression had 6.7% (z = 3.764, p < 0.001) lower total hippocampal volume. All significant results showed significant heterogeneity (Table 2 and Fig. 8; Appendix 1, Fig. S6).
Volumetric effect of depression in total hippocampus without comorbid anxiety. Forest plots of (A) the effect of depression without comorbid anxiety in total hippocampus, and of the effect of depression in total hippocampus for the following subgroups: (B) mixed group and (C) late-onset depression. Positive values represent greater volumes in healthy controls, and negative values represent greater volumes in participants with depression. Unit of measurement is millilitres. CI = confidence interval; DEP = participants with depression; HC = healthy controls; MD = mean difference; RE = random-effects; THcV = total hippocampus volume.
Twenty-eight studies reported right and left hippocampal volume differences (n = 2773, age 54.8 yr, 64.6% female).40,44,50–52,54,56–58,61,62,64,70–74,79,81,83–87,93,94,96,97 Significant differences represented 4.4% (z = 4.433, p < 0.001) lower right and 4.2% (z = 4.294, p < 0.001) lower left hippocampal volume in participants with depression and no comorbid anxiety. We also found significant differences in 2 subgroups indicating that, compared with healthy controls, participants with depression in mixed groups had 4.4% (z = 3.400, p < 0.001) lower right and 4.8% (z = 4.025, p < 0.001) lower left hippocampal volumes and participants with late-onset depression had 6.6% (z = 3.113, p = 0.002) lower right and 6.2% (z = 3.412, p < 0.001) lower left hippocampal volumes. Except for participants with late-onset depression, all significant results showed significant heterogeneity (Table 2, Fig. 9, Fig. 10 and Appendix 1, Fig. S8 and S10).

Volumetric effect of depression in right hippocampus without comorbid anxiety. Forest plots of (A) the effect of depression without comorbid anxiety in right hippocampus, and of the effect of depression in right hippocampus for the following subgroups: (B) mixed group and (C) late-onset depression. Positive values represent greater volumes in healthy controls, and negative values represent greater volumes in participants with depression. Unit of measurement is millilitres. CI = confidence interval; DEP = participants with depression; HC = healthy controls; MD = mean difference; RHcV = right hippocampus volume; RE = random effects.

Volumetric effect of depression in left hippocampus without comorbid anxiety. Forest plots of (A) the effect of depression without comorbid anxiety in left hippocampus, and of the effect of depression in left hippocampus for the following subgroups: (B) mixed group and (C) late-onset depression. Positive values represent greater volumes in healthy controls, and negative values represent greater volumes in participants with depression. Unit of measurement is millilitres. CI = confidence interval; DEP = participants with depression; HC = healthy controls; LHcV = left hippocampus volume; MD = mean difference; RE: random effects.
Putamen
Six studies reported total, right and left putamen volume differences (n = 607, age 60.0 yr, 66.2% female).71,83,94,98–100 Significant differences represented 4.2% (z = 2.704, p = 0.007) lower total, 4.3% (z = 3.137, p = 0.002) lower right and 4.2% (z = 2.247, p = 0.025) lower left putamen volumes in participants with depression and no comorbid anxiety. Only the significant result in total putamen volume showed significant heterogeneity (Table 2; Fig. 7B, D and E; and Appendix 1, Fig. S18, S20 and S22).
Pallidum
Four studies reported right pallidum volume differences (n = 306, age 53.3 yr, 59.2% female).71,83,94,98 Significant differences represented 3.2% (z = 2.067, p = 0.039) lower right pallidum volume in participants with depression and no comorbid anxiety (Table 2, Fig. 11A and Appendix 1, Fig. S32).
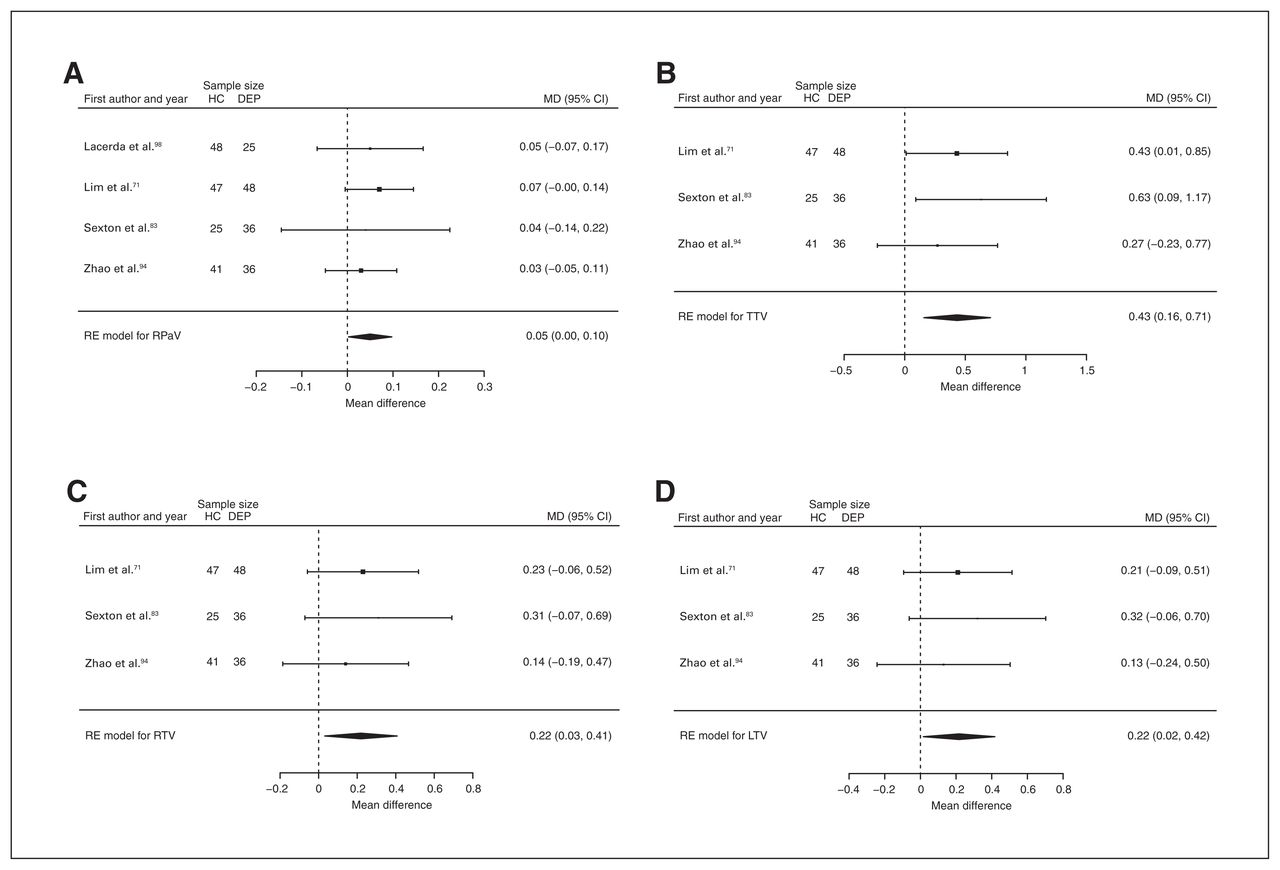
Volumetric effect of depression in pallidum and thalamus without comorbid anxiety. Forest plots of (A) the effect of depression without comorbid anxiety in right pallidum, and of the effect of depression without comorbid anxiety in (B) total thalamus, (C) right thalamus and (D) left thalamus. Positive values represent greater volumes in healthy controls, and negative values represent greater volumes in participants with depression. Unit of measurement is millilitrers. CI = confidence interval; DEP = participants with depression; HC = healthy controls; LTV = left thalamus volume; MD = mean difference; RE = random effects; RPaV = right pallidum volume; RTV = right thalamus volume; TTV = total thalamus volume.
Thalamus
Three studies reported total, right and left thalamus volume differences (n = 233, age 58.3 yr, 63.5% female).71,83,94 Significant differences represented 3.1% (z = 3.086, p = 0.002) lower total, 3.3% (z = 2.290, p = 0.022) lower right and 3.1% (z = 2.120, p = 0.034) lower left thalamus volumes in participants with depression and no comorbid anxiety (Table 2; Fig. 11B, C and D; and Appendix 1, Fig. S36, S38 and S40).
Intracranial volume
Twenty-six studies reported intracranial volume differences (n = 2741, age 53.8 yr, 66.0% female).13,15,34,40,54,56,61,67,70,72,74,83,85,86,106,109–112,115,118–122,124 Significant differences represented 1.0% (z = 2.225, p = 0.026) lower intracranial volume in participants with depression and no comorbid anxiety (Table 2 and Appendix 1, Fig. S45).
Assessment of comorbid anxiety: analysis with comorbid anxiety disorders
We investigated 8 regions, given minimum requirements: 3 global and 5 subcortical structures. A summary of volumetric differences in each region is provided in Figure 2 (right). Effects were 2.7% ± 2.8 (mean ± SD; range −0.5% to 9.5%) lower compared with depression and no comorbid anxiety. We found significant differences only in the amygdala (Table 3 and Appendix 1, Table S5 for detailed demographics).
Meta-analyses per brain region in depression comorbid with anxiety
Amygdala
Four studies reported total and left amygdala volume differences (n = 366, age 36.2 yr, 55.2% female).60,68,91,125 Significant differences represented 1.9% (z = −2.566, p = 0.010) greater total and 3.6% (z = −3.317, p < 0.001) greater left amygdala volumes in participants with depression and comorbid anxiety (Table 3, Fig. 12 and Appendix 1, Fig. S12 and S16).

Volumetric effect of depression in amygdala with comorbid anxiety. Forest plots of (A) the effect of depression with comorbid anxiety in total amygdala and (B) left amygdala. Positive values represent greater volumes in healthy controls, and negative values represent greater volumes in participants with depression. Unit of measurement is millilitres. CI = confidence interval; DEP = participants with depression; HC = healthy controls; LAV = left amygdala volume; MD = mean difference; RE = random effects; TAV = total amygdala volume.
Single study influence
We found no widespread evidence of single study influence, except for 1 study on intracranial volume ( Appendix 1, Table S8).
Bias assessment
We detected evidence of bias in nearly half of all analyses (49%) using Egger regression and the trim-and-fill method, although we observed poor agreement between methods. However, bias changed the significance of the results in only a few cases. Twelve analyses that had previously been identified as nonsignificant attained significance once bias was accounted for. One analysis that was previously identified as significant (in left putamen volume) became nonsignificant once bias was accounted for, but the direction of effect remained unchanged (Appendix 1, Table S9).
Meta-regressions
Neither age nor sex was found to account for a significant proportion of the observed variance in total brain volume and hippocampal volume, individually or as part of models. We found similar results for segmentation procedure, depressive symptoms and medication status in hippocampal volume. Only sex — as the difference in percent female — was found to account significantly for 22.36% (Q p = 0.033) of the variance in intracranial volume (mean −1.020, 95% CI −1.956 to −0.085 mL, z = −2.138, p = 0.033). In this manner, a higher percentage of females among participants with depression influenced reductions in intracranial volume (Appendix 1, Table S10).
Discussion
To the best of our knowledge, this is the first comprehensive systematic review of brain differences in depression to specifically consider comorbid anxiety. We showed that depression is associated with more widespread brain differences than previously demonstrated4–6 and, critically, that careful consideration of comorbid anxiety has a substantial effect on the magnitude of these differences.
Main findings
The effects of depression were larger in subcortical structures and most prominent in the hippocampus and thalamus, where significant reductions ranged from 3% to 7%. However, when we investigated depression in the absence of comorbid anxiety, the magnitude of these effects increased by 1% and revealed differences not previously reported4–6,20 in the bilateral thalamus, bilateral putamen and right pallidum. Furthermore, a key finding was the 3% reduction in volumetric differences attributable to depression in the presence of comorbid anxiety.
Subcortical structures
Hippocampal differences were consistent with previous reviews4–8,12,20 and provided further evidence of an effect of depression on this structure. In line with previous metaregressions,4,5 neither age nor sex, symptom severity, medication status or segmentation procedure influenced the magnitude of the hippocampal effects. However, hippocampal atrophy is associated with normal aging,126 and the lack of significant effects may reflect a narrow age cohort available for analysis, or the influence of other unknown variables as demonstrated by the high residual heterogeneity. Nevertheless, these findings have profound implications for an aging population. Normal aging is associated with hippocampal atrophy in late life of up to 1.1% per year,126 with an increase to 2.5% per year in mild cognitive impairment.127 In this manner, the effects linked to depression may be equated to up to 3 to 4 years of typical aging, and may have implications for neurocognitive disorders.
Differences in thalamus and basal ganglia structures, on the other hand, have been inconsistently reported in depression,4–6,10,20 and have only been shown in the context of total volumes.5,20 Our findings demonstrate that differences in bilateral thalamus, bilateral putamen and right pallidum are also detectable in depression, although with a lower level of confidence in left putamen. Notably, these findings may elucidate some depression symptomatology. Commonly reported sleep and appetite disturbances may be associated with thalamic differences;11,128 differences in putamen and pallidum, and their association with the reward system, may explain apathy and anhedonia6,129,130 and may have implications for motor disturbances.128
Higher volumes in the amygdala have been inconsistently reported in depression,4–6,19 and significant effects have been shown only when controlling for medication status.19 We identified both higher and lower amygdala volumes in depression, although our analyses demonstrate that this apparent inconsistency is explained by comorbidity. Higher amygdala volumes were identified only in the context of comorbid anxiety, consistent with anxiety-related amygdalar hyperactivity.131 However, we note that our results differed from previously reported lower amygdala volumes in a voxel-based morphometry review.22 Methodological differences between structural and whole-brain analysis approaches are likely to account for the discrepancy, but clinical features may also contribute, since the earlier review analyzed a more homogeneous sample with multiple episodes.
Grey matter volume and intracranial volume
This review was also the first report of lower grey matter volume and intracranial volume in depression,4–6 possibly because of the larger number of studies included. Although the magnitude of these effects was lower than that of subcortical structures, it is worth noting that a 2% difference in grey matter volume represents a greater absolute tissue loss than that observed in the hippocampus and amygdala combined. Therefore, this effect reflects not only the reduction detected in these structures but also a more widespread, global effect that may underlie cognitive symptoms. In contrast, intracranial volume differences need further scrutiny. Meta-regression showed that part of this effect (22%) was attributable to sex: a greater proportion of females with depression explained lower volumes. Furthermore, a single study was found to have undue influence on effects, putting into question the reliability of the findings for intracranial volume.
Chronic symptoms, age and laterality
There is an ongoing debate about whether brain differences associated with depression are modulated by depression symptoms, or by other factors such as laterality. Subgroup analyses suggested greater effects in the context of depression with multiple episodes and with late-onset depression. Although only significant in the hippocampus, these effects were consistent with previous meta-analyses5–7 and highlight the effect of symptom chronicity and the conjoint influence of depression and aging. Laterality effects, on the other hand, were not uniform. Smaller volumes were found mostly in the right hemisphere, with differences as high as 2% in some structures. However, we found the opposite trend in caudate and amygdala; the role and relevance of laterality effects needs further scrutiny.
Neurobiology of volumetric effects
Although the pathophysiology of depression remains unclear,11,132 the effects reported may reflect pathological activation of specific biological pathways and their combined effects.132 Brain atrophy may arise from hyperactivity of the hypothalamic–pituitary–adrenal axis and the neurotoxic effects of chronically elevated glucocorticoid levels.133 Hypothalamic–pituitary–adrenal hyperactivity directly affects immune response, particularly through heightened proinflammatory activity.11,132 Chronically elevated proinflammatory cytokine levels are associated with impaired synaptogenesis and excessive microglial activation,11 and may disrupt the integrity of the blood–brain barrier.134 These effects translate to a neurotoxic environment that leads to impaired neurogenesis, neuronal loss and, over time, loss of brain tissue.11,132,134 This pathological cascade would affect most brain regions, but is likely to be more prominent in the thalamus and hippocampus, given their sensitivity to glucocorticoids,135 and even more for the hippocampus given its involvement in neurogenesis.
In contrast, increased amygdalar volumes may be linked to heightened synaptogenesis or dendritic tree expansion134 due to hyperactivity in anxious states.131 Increased volume has been demonstrated in patients with posttraumatic stress disorder,136 but, conflicting evidence has been reported.137 The neurobiology of the conjoint effect of depression and anxiety remains unknown, and limited literature precludes further insight. Our findings suggest a distinct pattern of volumetric differences, but it remains unclear whether these differences predate the onset of comorbidity, whether there is an ordered sequence where one disorder precedes the other, or whether these differences are the result of treatment. People with depression and comorbidity have been shown to have poor response to therapy, more adverse effects and lower remission rates,18 which would likely increase the number of treatments compared with other people with depression.
Limitations
We report a comprehensive account of the effect of depression and comorbid anxiety in brain structure, but some limitations must be acknowledged. Limited data on symptom severity and medication status reduced the sample size in meta-regressions to less than half of the included studies. These limitations further extended to subgroup analyses, where effects could not be studied in all structures. Significant heterogeneity in hippocampal meta-regressions indicated that other variables not investigated here make significant contributions to observed differences. Finally, the cross-sectional nature of the analyses limited causal inference. Longitudinal reviews with long follow-up periods are needed to demonstrate unambiguously that depression causes brain atrophy.
Conclusion
The present findings demonstrate profound and consistent brain changes associated with depression modulated by the presence of comorbid anxiety, chronicity of symptoms and onset of illness. Comorbid anxiety masked the effect of depression and underestimated volume differences, emphasizing the need for future studies to consistently examine anxiety comorbidity as a means of better understanding the independent role of each disorder in brain structure. These findings further highlight the need for effective treatments to improve long-term mental health and prevent additive effects to neurocognitive disorders later in life. People with depression and without comorbid anxiety are at higher risk of neurocognitive insults; screening for anxiety symptoms may effectively target this population for early intervention.
Footnotes
Funding: D. Espinoza Oyarce is funded by the Australian Government Research Training Program (AGRTP) Scholarship. The funder had no further role in study design; in the collection, analysis and interpretation of data; in the writing of the review; and in the decision to submit the paper for publication.
Competing interests: None declared.
Contributors: D. Espinoza Oyarce and N. Cherbuin designed the study. All authors acquired and analyzed the data. D. Espinoza Oyarce, M. Shaw and N. Cherbuin wrote the article, which all authors reviewed. All authors approved the final version to be published and can certify that no other individuals not listed as authors have made substantial contributions to the paper.
- Received September 17, 2019.
- Revision received February 7, 2020.
- Accepted February 27, 2020.
References
In this issue

Article tools


