
Abstract
Background: Functional neural impairments have been documented in people with symptomatic Huntington disease (symp-HD) and in premanifest gene carriers (pre-HD). This study aimed to characterize synchrony in resting state cerebral networks in both pre-HD and symp-HD populations and to determine its association with disease burden and neurocognitive functions.
Methods: We acquired functional magnetic resonance imaging (fMRI) data from pre-HD, symp-HD and healthy control participants. The fMRI data were analyzed using multisubject independent component analysis and dual regression. We compared networks of interest among the groups using a nonparametric permutation method and correcting for multiple comparisons.
Results: Our study included 25 people in the pre-HD, 23 in the symp-HD and 18 in the healthy control groups. Compared with the control group, the pre-HD group showed decreased synchrony in the sensorimotor and dorsal attention networks; decreased level of synchrony in the sensorimotor network was associated with poorer motor performance. Compared with the control group, the symp-HD group showed widespread reduction in synchrony in the dorsal attention network, which was associated with poorer cognitive performance. The posterior putamen and superior parietal cortex were functionally disconnected from the frontal executive network in the symp-HD compared with control and pre-HD groups. Furthermore, the left frontoparietal network showed areas of increased synchrony in the symp-HD compared with the pre-HD group.
Limitations: We could not directly correct for influence of autonomic changes (e.g., heart rate) and respiration on resting state synchronization.
Conclusion: Our findings suggest that aberrant synchrony in the sensorimotor and dorsal attention networks may serve as an early signature of neural change in pre-HD individuals. The altered synchrony in dorsal attention, frontoparietal and corticostriatal networks may contribute to the development of clinical symptoms in people with Huntington disease.
Introduction
Huntington disease is an autosomal dominant neurodegenerative disorder caused by an expansion of CAG repeats in the HTT gene, which encodes the huntingtin protein.1 Clinical diagnosis is currently based on unequivocal motor signs of chorea and/or bradykinesia;2 however, there are significant early cognitive deficits that may develop independently of motor signs.3,4 In the symptomatic stages of Huntington disease (symp-HD), loss of medium spiny neurons and atrophy in the striatum are characteristic neuropathological changes.5,6 Sensitive biomarkers of disease onset and progression during the premanifest (pre-HD) stages are urgently needed as possible candidate markers for use in therapeutic trials.7 Functional magnetic resonance imaging (fMRI), via the measurement of blood oxygen level–dependent (BOLD) response, can detect early and subtle alterations in brain function8,9 and permits investigation of disease-related changes in synchronization in brain networks in patients with Huntington disease.10–12
Functional connectivity between specific brain regions, measured using univariate correlations in BOLD signal time-course, has been assessed in various clinical populations (e.g., Alzheimer disease, Parkinson disease, multiple sclerosis). In studies of Parkinson disease, corticostriatal connectivity can differentiate patients from controls; patients showed significantly decreased coupling between the posterior putamen and inferior parietal cortex in association with increased functional connectivity with the anterior putamen,13 maybe due to remapping as a result of dopamine depletion. Unschuld and colleagues14 conducted the first resting state study in pre-HD individuals and measured correlations between BOLD signal in the caudate and 13 cortical brain regions. The authors found reduced corticostriatal connectivity in pre-HD individuals compared with controls. Longitudinal changes in functional connectivity have also been reported in pre-HD individuals,10 with decreased striatal functional correlations associated with potential disease severity (measured with estimated years to onset and striatal volume).
Multivariate data-driven methods can identify functionally distinct resting-state brain networks.11,12,15 Methods have also been developed to allow comparison of spatiotemporal dynamics of neural synchrony in resting state networks between clinical and healthy populations.12,16 For example, Roosendaal and colleagues17 reported significantly increased synchrony in the default network in patients with multiple sclerosis compared with controls and suggested cortical re-organisation as a likely contributing factor. Moreover, in carriers of the APOE-ɛ4 gene (predictive of Alzheimer disease) functional resting state changes have been observed before onset of clinical symptoms.12 Collectively, these findings support the utility of multivariate resting state analysis as an important method for detection of early changes in neural synchrony in clinical populations.
In patients with Huntington disease, there is some evidence for altered connectivity between brain regions both during cognitive task performance18–21 and at rest.10,14 Wolf and colleagues21 found significant reduction in left frontoparietal and putamen connectivity during working memory. Thiruvady and colleagues19 found that a cognitive interference task increased the connectivity between brain hemispheres in controls, but not in symp-HD individuals. The authors also reported significantly impaired connectivity between the anterior cingulate and lateral prefrontal regions bilaterally in symp-HD individuals. In addition, poor task performance in symp-HD individuals was predicted by reduced functional connectivity, shown as reduced synchrony in pre-frontal regions during the task. More recently, Wolf and colleagues22 used a multivariate method to identify the default mode network in pre-HD individuals during a cognitive alertness task and reported lower connectivity compared with controls in medial prefrontal and posterior cingulate nodes of the default mode network.
Multivariate positron emission tomography (PET) studies were the first to identify Huntington disease–related reproducible metabolic networks comprising the striatum, thalamus and motor cortex.15,23 However, the extent of spatiotemporal synchrony in the resting state networks in patients with Huntington disease remains unknown. Such an investigation is highly relevant since resting state networks may offer less variable measures of cerebral dysfunction than performance-based fMRI tasks, which often yield highly variable findings.10,24 The only 2 previous resting state connectivity studies, both conducted in pre-HD individuals, used a correlation analysis to identify the association of specific cortical structures with specific striatal regions of interest (ROI).10,14 In the present investigation we aimed to use a multivariate analysis method to identify spatially independent resting state networks in a large number of pre-HD and symp-HD individuals (from the IMAGE-HD study25), identify specific networks of impairment that differentiate between pre-HD and symp-HD individuals, and identify how levels of synchrony are associated with disease burden and cognitive and motor performance. Based on previous studies, we predicted that the pre-HD group would show altered synchrony in corticostriatal networks, whereas the symp-HD group would show more widespread connectivity disruptions in both cortico-cortical and corticostriatal networks (compared with pre-HD individuals and controls). Second, we predicted that the level of synchrony would be associated with disease burden and cognitive and motor performance in both pre-HD and symp-HD groups.
Methods
Participants
We recruited pre-HD, symp-HD and healthy control individuals from the Australian-based IMAGE-HD study25,26 for the present investigation. All participants were required to be right-handed (as per the Edinburgh Handedness Test27) and, other than Huntington disease, must have had no known brain injury or neurologic or psychiatric conditions. The participants in the pre-HD and control groups were matched for age. Groups were originally sex-matched at baseline testing (2008–2009); however, owing to attrition of some participants and/or the quality of scans, the groups were not able to be fully sex-matched in the present investigation. A previous study has shown no significant differences between the sexes in functional connectivity during the resting state.28
Pre-HD and symp-HD individuals underwent gene testing before enrolment in the study, were assessed by a clinician (A.C. or P.C.) and underwent a Unified Huntington’s Disease Rating Scale (UHDRS) motor assessment. As per Tabrizi and colleagues,29 inclusion in the pre-HD group required a UHDRS total motor score of 5 or lower. We estimated the years to clinical onset for pre-HD individuals and disease burden scores (DBS) for symp-HD and pre-HD individuals according to formulas based on the participant’s age and number of CAG repeats on the expanded allele.30,31
As part of the IMAGE-HD protocol, all participants underwent neurocognitive and neuropsychiatric assessments, selected based on their sensitivity in previous large multisite studies.3,32 The National Adult Reading Test 2nd edition scores33 were used to estimate IQ, and the Symbol Digit Modalities Test34 (SDMT) and the Stroop word reading condition only were used to assess visual search and attention.35 Neuropsychiatric symptoms were assessed using the Schedule of Obsessions, Compulsions and Pathological Impulses36 (SCOPI), the Frontal Systems Behaviour Scale37 (FrSBe), both anxiety and depression scales from the Hospital Anxiety and Depression Scale38 and the Beck Depression Inventory Version II.39 Previous studies have reported impairments in odour identification in patients with Huntington disease;40 therefore, we assessed odour identification using a 20-item modification of the University of Pennsylvania Smell Identification Test41 (UPSIT). Psychomotor speed and timing were assessed using speeded tapping and self-paced tapping (fast at 3.0 Hz and slow at 1.82 Hz) tasks.3
The Monash University and Melbourne Health Human Research Ethics committees approved our study. All participants provided written informed consent in accordance with the Declaration of Helsinki.
MRI acquisition
Structural and functional data were acquired at the Murdoch Childrens Research Institute (Royal Childrens Hospital, Victoria, Australia) on a Siemens Magnetom Tim Trio 3 T MRI scanner (Siemens AG) using a 32-channel head coil. High-resolution anatomic images of the whole brain were acquired using T1-weighted anatomic scans (192 slices, 0.9 mm slice thickness, 0.8 mm × 0.8 mm in-plane resolution, echo time [TE] 2.59 ms, repetition time [TR] 1900 ms, flip angle 90°). Functional images were acquired using echo-planar imaging (30 slices, 4 mm slice thickness, 1.8 mm × 1.8 mm in-plane resolution, TE 35 ms, TR 2250 ms, flip angle 90°). Participants were provided with earplugs to lessen the high-volume acoustic noise from the scanner. Additional pads were placed on both sides of the head to minimize head motion. During the resting state fMRI scanning, the participants were instructed to close their eyes and remain awake. Resting state scans comprised 150 volumes (5 min, 37 s).
MRI data preprocessing
The MRI data were preprocessed and analyzed using SPM8 (www.fil.ion.ucl.ac.uk/spm) and FSL toolboxes (FMRIB). We also used SPM8 to perform motion correction and normalization of MRI data, and FSL was used to perform multivariate exploratory linear decomposition into independent components (MELODIC) analysis of normalized fMRI data. To ensure confident and reliable estimates of neural activity within groups known to differ in localized neural (particularly striatal) volume, particular attention and a stringent spatial preprocessing method was applied in SPM8. Functional images were initially aligned and movement parameters estimated for each participant, followed by fMRI registration to individual T1-weighted scans in Montreal Neuroligical Institute (MNI) space. Spatial normalization parameters were then estimated from T1 scans, allowing for increased degree of localized volume and shape corrections (largely to account for striatal neurodegeneration) via the “SPM8 Segment” function (spatial regularization 0.02, discrete cosine transform warp frequency cutoff of 22). This approach applies estimated tissue probability maps within a unified model also accounting for individual variability in neural structure and B0 field inhomogeneities.42 Functional images were then normalized to MNI space (2 mm isotropic voxels), and each participant was carefully checked for normalization accuracy. Finally, to account for small residual differences in periventricular boundary among the groups, before analysis all participants’ fMRI scans were masked by a probabilistic estimate of cerebrospinal fluid and skull derived from the group-averaged symp-HD baseline structural scan, ensuring all functional and structural scans were matched, voxel for voxel, throughout the brain (see the Appendix, Fig. S1, available at cma.ca/jpn).
Group-level independent component analysis
In FSL, the normalized fMRI images were spatially smoothed using a 5 mm full-width at half-maximum Gaussian kernel. The 4-dimensional (4D) data set was grand-mean scaled and high-pass filtered (Gaussian-weighted least squares straight fitting line fitting, using a cut-off of 100 s). The preprocessed and normalized fMRI data sets from each participant in each group were temporally concatenated to create a single 4D data set. The concatenated data were decomposed using MELODIC (implemented in FSL toolbox) to identify large-scale patterns of functional synchrony in the study population. The numbers of components were estimated using Laplace approximation to the Bayesian evidence for a probabilistic principal component model.
Dual regression
To identify participant-specific patterns of neural synchrony for each of the group-level resting state networks, a method based on dual-regression of group-level independent components against each participant’s data set was used.12,16 The dual regression method is based on the following generalized linear model (GLM) dual regression equations:

where Yi represents the fMRI data from the ith participant, S represents group-level unthresholded independent component analysis (ICA) spatial maps, and Xi is the regression weight in time domain. The first part of the dual regression equation spatially regressed group-level unthresholded ICA maps (S) against individual participants’ fMRI data sets, resulting in time courses representing neural synchrony (X) for each group-level component and participant.16 These time-courses were then normalized for variance and used in a linear temporal regression against the associated participant’s fMRI data set, as shown in the second equation. This process resulted in participant-specific spatial maps with values in each voxel reflecting synchrony with group-level resting state networks. Thus, the synchrony scores reflected both correlations in amplitude of spontaneous fluctuations and their coherence across space.12,16,17
Statistical analysis
We selected networks of interest using visual inspection and spatial correlation against a set of previously defined maps.11 Spatial correlations were performed between group-level ICA maps and the resting state maps from the study by Smith and colleagues11 using the “fslcc” command available in FSL. Only the networks showing a moderate spatial correlation (r > 0.5) were further considered for analysis.
For statistical comparison of neural synchrony among the groups and for each network of interest, we merged spatial maps comprising synchrony values from each participant into 4D files. We created the GLM, modelling group differences after controlling for age and average motion, using the FSL GLM toolbox. The GLM was estimated for each 4D map using a statstical method based on non-parametric permutation testing (5000 permutations), as implemented in the “randomize” command available in FSL. Significant differences among the groups were controlled for multiple comparisons using a corrected threshold of p < 0.05 with threshold-free cluster enhancement (TFCE).43 All analyses included age and absolute head motion (average) as covariates to control for any age and motion-related effects across groups.
Correlation analysis
To test for significant associations between changes in synchronization in brain networks and disease burden, cognitive and motor performance in pre-HD and symp-HD groups, we extracted synchrony scores from the networks of interest and correlated them against measures of interest. We selected motor (i.e., precision of self-paced tapping fast [target rate of 3 Hz]) and cognitive (Stroop word reading and SDMT) tasks previously shown to be sensitive to progression of Huntington disease.44,45 The calculation for timing precision is 1 ÷ the standard deviation of the intertap interval in seconds.44,46 We also selected DBS as a symptom-free measure of gene expression across both Huntington disease groups. We used SPSS version 16.0 to perform Spearman rank correlation. Correlation analyses were restricted to the regions in the network that showed significant differences among the groups and were predicted to be associated with motor and cognitive performance. For example, motor performance was correlated with the sensorimotor network, and cognitive performance was associated with frontoparietal and attentional networks. We considered correlation values to be significant at p < 0.05, Holm–Bonferroni corrected for each network of interest.
Results
Participants
We included 25 participants in the pre-HD group, 23 in the symp-HD group and 18 in the control group. There was no difference among the groups in IQ. In the pre-HD and symp-HD groups, CAG repeat length ranged from 39 to 50 (mean 42.5 ± 1.9 for pre-HD; 42.6 ± 2.0 for symp-HD). The average estimated years to clinical onset for the pre-HD group was 13.5 ± 8 years, and the mean overall DBS was 287.7 ± 61.8. Individuals in the symp-HD group all had a UHDRS motor score greater than 5, and the duration of illness ranged from 5 months to 5 years, with a group mean DBS of 389.6 ± 65. Demographic and clinical characteristics of all participants are displayed in Table 1. The symp-HD group differed significantly from both the control and pre-HD groups in SDMT, Stroop word reading, speeded and self-paced tapping, and odour recognition (UPSIT). The symp-HD individuals differed from controls only in FrSBE and SCOPI scores. Controls also differed from pre-HD individuals in FrSBE scores (executive dysfunction subscale). A summary of neuro-cognitive measures is provided in the Appendix, Table S1.
Participant demographic and clinical characteristics across all groups
Resting state networks
The MELODIC analysis generated 21 spatially independent components representing group-averaged networks of brain regions with correlations in spontaneous BOLD fMRI signal. Nine of these networks showed a significant spatial overlapping (spatial correlation > 0.5) with resting state networks described previously.11 These have been found to reflect functional organization in the brain and represent sensorimotor (Fig. 1A), dorsal attention (Fig. 1B), executive function (Fig. 2B), left and right frontoparietal (working memory; Fig. 2C and 3A), auditory (Fig. 3B), visual (Fig. 3C), default mode (Fig. 3D) and cerebellar (perception) networks.

Resting state networks identified using multivariate exploratory linear decomposition into independent components, which were altered in premanifest gene carriers of Huntington disease (pre-HD). (A) Sensorimotor network: synchronization was decreased in the primary motor area (M1) in pre-HD individuals compared with controls. (B) Dorsal attention network: decreased synchronization in the visual area in pre-HD individuals compared with controls.

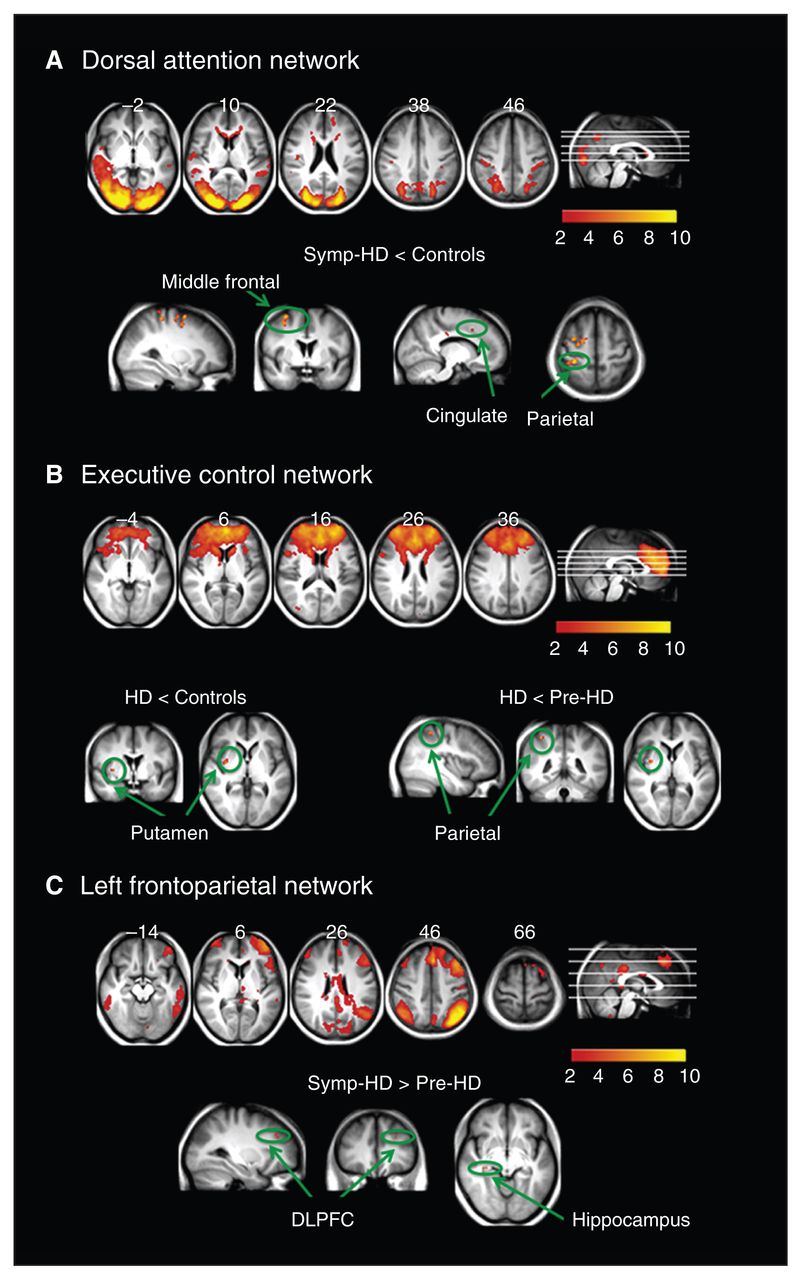
Resting state networks identified using multivariate exploratory linear decomposition into independent components, which were altered in individuals with symptomatic Huntington disease (symp-HD). (A) Dorsal attention network: synchronization was decreased in symp-HD individuals compared with controls in the middle/superior frontal area, postcentral gyrus and cingulate. (B) Executive control network: decreased synchrony with the putamen in symp-HD individuals compared with controls, and further decreased synchrony with the superior parietal lobule compared with premanifest gene carriers of Huntington disease (pre-HD). (C) Left frontoparietal network: increased synchrony in the left dorsolateral prefrontal cortex and right hippocampus compared with pre-HD individuals only. DLPFC = dorsolateral prefrontal cortex.
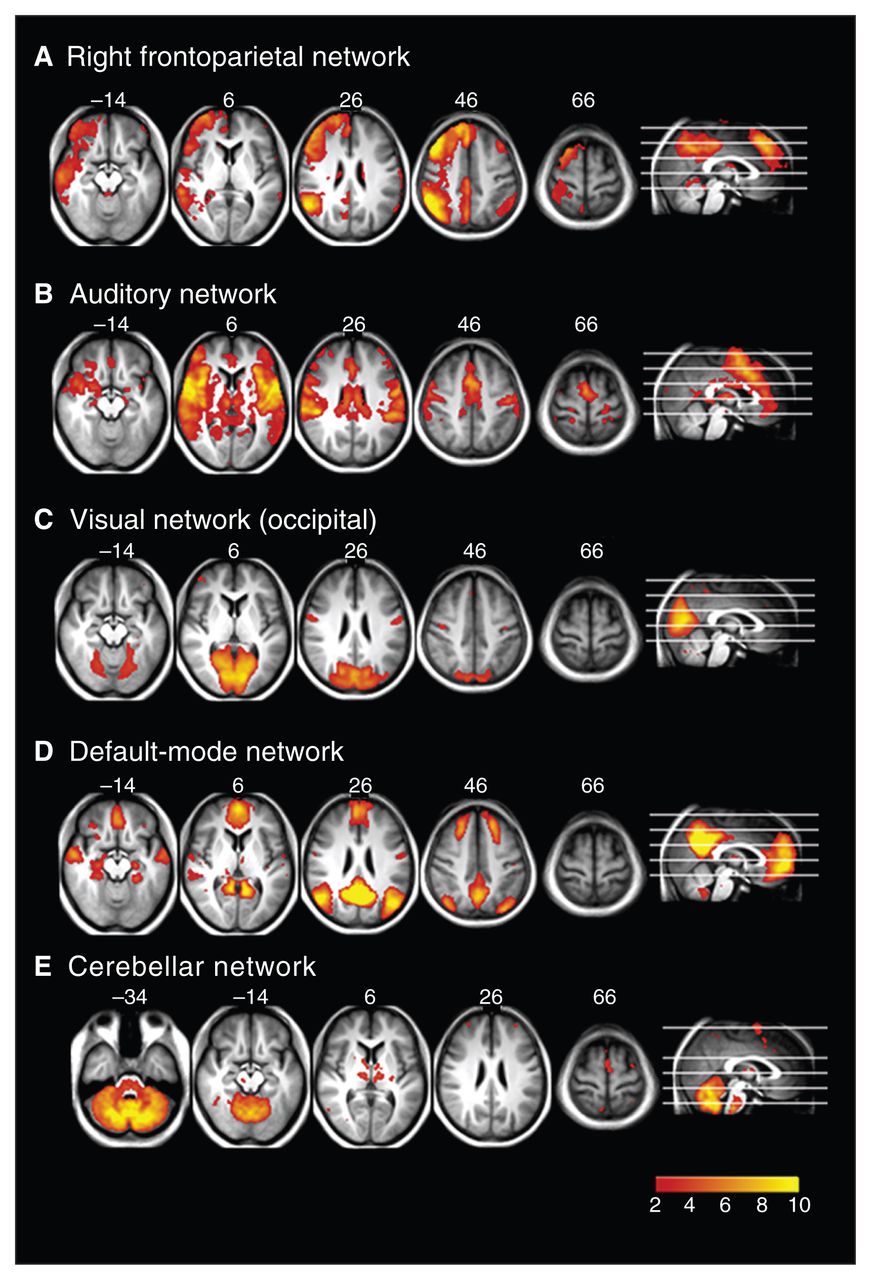
Resting state networks identified using multivariate exploratory linear decomposition into independent components (MELODIC), which were not altered in any of the groups: (A) right frontoparietal network, (B) auditory network, (C) visual network, (D) default mode network and (E) cerebellar network.
We compared voxel-wise functional synchrony of the 9 resting state networks across the 3 groups. Four of the 9 networks showed brain regions with significant differences in synchrony among groups (Table 2). For example, the pre-HD group showed significantly reduced (p < 0.05, TFCE-corrected) synchronization compared with controls in the sensorimotor network (Fig. 1A), with a focal reduction in the medial primary motor area (M1) just posterior to the supplementary motor area (SMA). Subthresholding the statistical images (p < 0.01, corrected) revealed that this cluster extended to the SMA anteriorly. The pre-HD group also showed significantly reduced synchrony compared with controls in the lateral visual area of the dorsal attention network (Fig. 1B).
Anatomic location, MNI coordinates (mm), and corrected p values corresponding to altered connectivity in resting state networks in pre-HD and symp-HD groups
Figure 2 shows brain regions in which the symp-HD group differed significantly from the control and pre-HD groups. The strongest and most widespread reduction in synchronization (p < 0.05, corrected) was observed in the dorsal attention network (bilateral middle/superior frontal, postcentral, and anterior cingulate cortices; Fig. 2A). Compared with the control and pre-HD groups, the symp-HD group showed significantly reduced synchrony between the putamen and the executive control network. There was further reduction in connectivity between the executive control network and the superior parietal cortex in the symp-HD compared with the pre-HD group (Fig. 2B). Furthermore, the symp-HD group had increased synchronization in the right hippocampus and left dorsolateral prefrontal cortex compared with the pre-HD group; however, this increase was not significant when compared with the control group.
Figure 3 shows the resting state networks where there was no difference between any groups. These include the right frontoparietal (Fig. 3A), auditory processing (Fig. 3B), visual (Fig. 3C), default mode (Fig. 3D) and cerebellar (Fig. 3E) networks.
Association between resting state neural synchrony and disease burden and cognitive and motor measures
In the pre-HD group, synchrony in the medial primary motor cortex (part of the sensorimotor network) positively correlated with tapping precision (self-paced tapping fast; r = 0.47, p = 0.021), after controlling for effects of age and DBS (partial correlation; Fig. 4A). The correlations between synchrony in the medial primary motor cortex and motor performance (self-paced tapping fast) were not significant in the symp-HD and control groups (Appendix, Table S2).

Scatter plots of synchrony score and measure of interest in the premanifest gene carriers of Huntington disease (pre-HD) and symptomatic Huntington disease (symp-HD) groups. (A) Correlation between residual synchrony in the primary sensorimotor network (M1) and residual tapping precision (self-paced tapping fast, 3Hz), after controlling for age and disease burden score (DBS). (B) Correlation between residual synchrony in the dorsal attention network (cingulate) and residual Symbol Digit Modalities Test (SDMT), after controlling for age and DBS. (C) Correlation between synchrony in the hippocampus and DBS.
In the symp-HD group, synchrony between the anterior cingulate and dorsal attention network was negatively correlated with SDMT (r = −0.48, p = 0.023) performance after controlling for effects of age and DBS (Fig. 4B), whereas synchrony in the frontoparietal working memory network (hippocampus: r = −0.44, p = 0.037) was positively correlated with DBS (Fig. 4C). The pre-HD and control groups did not show significant correlations between SDMT and synchrony in the anterior cingulate–dorsal attention network connection (Appendix, Table S2).
Discussion
To our knowledge, this is the first study to investigate changes in spatially independent spontaneous resting state BOLD networks in both pre-HD and symp-HD individuals. Using a multivariate method to assess synchrony in BOLD fluctuations, we identified several well-established brain networks from the resting fMRI scans across groups. Moreover, using a method that measured changes in synchrony in both BOLD signal amplitude and across space, we identified several networks that were disrupted in both pre-HD and symp-HD individuals compared with controls. We also identified significant associations between level of synchrony in a number of cortical and subcortical areas with clinical (i.e., DBS), cognitive (i.e., SDMT) and motor (i.e., self-paced tapping fast) measures.
We report that the resting state synchronization in the sensorimotor network is decreased in pre-HD individuals compared with controls and that the level of synchrony is associated with precision in motor performance measured using speeded self-paced tapping. Although the neurodegenerative process in patients with Huntington disease largely involves the striatum, a more diffuse pattern of functional change involving sensorimotor and frontoparietal areas has also been previously reported.14,21,47 For example, an earlier PET study showed reduced activation in the primary motor area, but with compensatory increases in parietal regions.48 Another PET study revealed differences in the corticostriatal motor network between pre-HD individuals and controls.15 More recent fMRI studies have suggested reduced M1 activity,49,50 with multiple compensatory increases in the pre-SMA and caudal SMA.50 The primary motor cortex has also shown regional thinning in pre-HD compared with control individuals,47 suggesting that cortical changes occur earlier than previously though in pre-HD individuals. Moreover, even early pre-HD individuals demonstrate a posterior–frontal pattern of cortical thinning compared with controls.29 Given the previous reports of early functional and structural change in the sensorimotor cortex, the reduced synchronization in the motor network observed in our study may represent a very early signature of a motor control circuit deficit in pre-HD individuals. Our finding that a reduction in tapping precision in these individuals was associated with reduced synchrony in M1 also provides support for this interpretation. A previous study has also identified tapping precision as a highly sensitive measure for detecting early motor changes in pre-HD individuals.51 Interestingly, there was no significant reduction in synchrony or a significant association between motor performance and synchrony in the sensorimotor network in the symp-HD group. The neurodegenerative changes that have been shown to manifest early in the sensorimotor network29 may have led to greater spatiotemporal variability in the symp-HD fMRI time series,52 which requires greater statistical power than we achieved in this study to detect group differences.
Pre-HD individuals also showed reduced synchronization in the lateral visual processing areas of the dorsal attention network. The dorsal attention network, which encompasses the occipitoparietal pathway, is crucial for the visual guidance of movement across space.53,54 Furthermore, the lateral visual areas are modulated by a top–down biasing process, which facilitates information processing and executive control.53 The disruption in functional synchronization within this region suggests that top–down modulatory pathways required for attentional functions may be functionally impaired in pre-HD individuals.
In the symp-HD group, the most widespread and strongest impairments were observed in the dorsal attention network; synchrony in the anterior cingulate cortex also correlated with measures of visual attention and speed (i.e., SDMT). Functional MRI studies probing cognitive and motor processes in symp-HD individuals provide a largely inconclusive picture of functional reorganization in the cerebral cortex, with decreased activity in occipital and parietal cortices55 as well as both increased55,56 and decreased activation in the bilateral middle frontal gyrus.57 In such task-based studies, however, heterogeneity in neuronal responses is variable, likely reflecting stage of disease, cognitive status and/or differences in behavioural performance. Resting state BOLD, on the other hand, provides a task-independent measure of neuronal activity and synchronization and, hence, may better reflect functional reorganization of the brain.11 Therefore, the relatively widespread impairment that we observed in the dorsal attention network in the symp-HD group most likely reflects signs of Huntington disease–related disruption in networks supporting attention and executive functions.
The executive control network also showed impaired synchronization with the putamen and superior parietal area. Postmortem and imaging studies have shown significant neurodegeneration of the posterior putamen in patients with Huntington disease,57–59 with the ventral anterior portion relatively spared.60 Our findings suggest that this focal neurodegeneration may result in a functional disconnection of the corticostriatal cognitive loop from the frontal executive system of the cerebral cortex. In line with our finding, diffusion tensor imaging studies have shown structural disconnecitivty in symp-HD individuals in the motor-cortical projection region of putamen.61 A PET study revealed a corticostriatal motor network that discriminated pre-HD individuals from controls.15 A further PET study showed that altered excitation of the striatum can modulate widespread cortical networks.62 While such disconnection of the posterior putamen from functionally specific cortical networks can result in compensatory increases in other striatal connections, such as that observed in patients with Parkinson disease,13 we observed no compensatory increased striatal synchrony in symp-HD individuals.
In the symp-HD group, there was also an increased synchrony in the left dorsolateral prefrontal cortex and right hippocampal connection with the frontoparietal network compared with the pre-HD group. Previous studies have suggested increased prefrontal and parietal activity during cognitive task performance in both near-to-onset pre-HD individuals8 and symp-HD individuals.56 Furthermore, increased cerebral blood flow has also been observed in the hippocampus in individuals near to symptom onset.63 However, it remains unknown whether there are compensatory mechanisms driving such increases in functional activity in symp-HD individuals. In the present study, increased synchrony in the frontoparietal network in the symp-HD group was associated with increased disease burden, suggesting that symp-HD individuals with stronger gene expression of disease need to compensate more, possibly owing to greater striatal neurodegeneration.
Limitations
There are some limitations to our study. We could not directly correct for influence of autonomic changes (e.g., heart rate) and respiration on resting state synchronization. However, our dual-regression approach regressed out any spatially independent noise patterns (possibly due to autonomic or respiration effects) before the generation of an individual participant’s synchrony pattern.12 Furthermore, the posterior cingulate cortex, which is highly influenced by autonomic fluctuations,64 did not show differences across groups in the present study, suggesting that there were no significant differences in influences of autonomic fluctuations among the groups. Moreover, we investigated synchronization only in large-scale functional networks previously reported and thus may have missed alterations in smaller subcortical networks, such as the basal ganglia.13,65 The synchrony values we obtained using the dual-regression method provide a linear statistical link between fMRI resting state time series. Therefore, reduced synchrony does not rule out other possible forms of connectivity between brain regions. This notwithstanding, synchrony measured using other advanced analytical methods, such as wavelet-based phase synchrony and partial directed coherence, are also limited owing to nonlinearity and nonstationarity inherent in fMRI time courses.66 More recent studies have suggested using data scrubbing methods to account for motion greater than 0.5 mm before connectivity analysis to remove any effects of motion on functional connectivity.67 Since all 3 groups in our study had an average absolute head motion less than 0.5 mm, we did not apply scrubbing methods to our multivariate analysis; however, motion was used as a covariate in our group-level model, effectively controlling for any potential spurious motion-related changes in synchronization.
Conclusion
Our study revealed changes in neural synchrony in widespread cortical and subcortical networks in both pre-HD and symp-HD groups. In particular, we found considerably decreased synchrony in the dorsal attention network and desynchrony between the putamen and executive control regions in the symp-HD group. In contrast, the pre-HD group showed reduced synchrony in sensorimotor and dorsal attention areas, which was associated with reduced motor function. In the symp-HD group, reduced synchrony in the dorsal attention network was associated with decreased efficiency of visual attention. The symp-HD group also showed compensatory increases in synchrony in the frontoparietal cortex, which increased with disease burden. Our findings indicate a differential pattern of reduced synchrony in various corticostriatal loops in patients with Huntington disease dependant on stage of disease. These results suggest that network alterations may contribute to the development of clinical symptoms in individuals with Huntington disease.
Acknowledgements
We acknowledge the contribution of all the participants who took part in this study. We are also grateful to the CHDI Foundation Inc. (grant number A – 3433), New York (USA), and to the National Health and Medical Research Council (NHMRC; grant number 606650) for their support in funding this research. This research was supported by the VLSCI’s Life Sciences Computation Centre, a collaboration between Melbourne, Monash and La Trobe Universities and an initiative of the Victorian Government, Australia. We also thank the Royal Children’s Hospital for the use of their 3T MR scanner. G.F. Egan is a Principal NHMRC Research Fellow.
Footnotes
Competing interests: None declared.
Contributors: All authors designed the study, reviewed the article and approved the final version for publication. A. Churchyard and P. Chua acquired the data, which G. Poudel, G.F. Egan, J. Stout and N. Georgiou-Karistianis analyzed. G. Poudel, G.F. Egan, J. Stout and N. Georgiou-Karistianis wrote the article.
- Received November 7, 2013.
- Revision received April 22, 2013.
- Accepted June 17, 2013.